Posts Tagged ‘Data Sources’
New Census Data Show Local Poverty Rates, Income Levels for 2010
 Median family incomes for counties across California decreased from 2009 to 2010, according to data released today by the Census Bureau. This set of data, from the American Community Survey, also includes local data for educational attainment, health insurance coverage, and several demographic measures.
On kidsdata.org, we include many measures of child well being from the American Community Survey, including the aforementioned median family income. 2010 data from this Census release will be added soon.
Given today’s news about family income data, the impact of the recession on California communities is becoming more evident. For more perspective on these data, here are some news articles from across the state:
- Modesto Bee: As Incomes Fall, More Stanislaus County Families Need Assistance
- San Jose Mercury News: Census Reveals Lower Bay Area Incomes, Rising Poverty
- Los Angeles Times: LA County Poverty Rate Jumps for Third Straight Year to 17.5%
Posted by kidsdata.org
Tags: Child Health Issues, Data Sources
New Census Data: More Than 1 in 5 American Kids Live in Poverty
 A new report released today by the Census Bureau notes concerning increases in child poverty from 2009 to 2010 across the country.
According to the report, Income, Coverage and Health Insurance in the United States: 2010, 22% of U.S. children lived in poverty in 2010 — that’s up from 20.7% in ’09, which translates to nearly 1 million more children in poverty. Also, in 2010, 9.8% of U.S. children were uninsured, but among children in poverty, the percentage was higher, at 15.4%.
The report is particularly timely, given that tomorrow we’ll be participating in a New America Media briefing about childhood poverty. The event will illustrate the challenges faced by low-income youth and families in the Bay Area from several different perspectives.
Here are a few other highlights of the census report:
- Annual median income levels in U.S. family households declined from $62,276 in 2009 to $61,544 in 2010 (Table 1, pg. 6)
- Households in the West experienced a greater decline in median household income than any other region across the country — 2.9% (Table 1, pg. 6)
Visit kidsdata.org for additional data on poverty, health care, and family income for your region.
Posted by kidsdata.org
Tags: Child Health Issues, Data Sources
New Presentations Help Journalists, Others Use Census Data
 As results from the 2010 Census are released, the need for tools to help wade through all these data is becoming clear. To help address this, Arizona State University and the McCormick Foundation funded experts to create 40-minute how-to presentations to assist journalists and the public in using specific Census data. The presentations include information on comparing data among regions, using online maps, and analyzing trends. These presentations were featured in a recent Policy for Results blog.
Posted by kidsdata.org
Tags: Data Projects, Data Sources
Health Observance Highlights Importance of Childhood Injury Prevention
National Child Injury Prevention Week begins this Thursday, Sept. 1. How many children suffer from injuries in your county? You can find out at kidsdata.org.
According to data recently updated on kidsdata.org, after a 7-year decline, the rate of hospitalizations for unintentional injuries in California has increased in recent years for children ages 1 to 4. In fact, the unintentional injury hospitalization rate declined for every other age group between 2007 and 2009 — 1-4-year-olds were the only age group for which rates increased.
These data are underscored by a recent American Academy of Pediatrics report about injuries from children accidentally falling out of windows, which found that children under age 4 were more likely to suffer head injuries and be hospitalized for their injuries than older children.
Organizations such as Safe Kids USA, the California Injury Prevention Network, and the CDC’s Youth Risk Behavior Surveillance System offer information and tips on keeping kids safe. If you know of other resources, please list them here.
Posted by kidsdata.org
Tags: Child Health Issues, Data Sources, Health Observances
America’s Children: New Report Compiles Federal Data
 A new report released this week by the Federal Interagency Forum on Child and Family Statistics (a.k.a. ChildStats.gov) summarizes how American children are faring using 41 key indicators offered through federal data sources.
This annual report, America’s Children: Key National Indicators of Well-Being, 2011, aims to depict “both the promises and the challenges confronting our Nation’s young people.” The report includes measures of child well being in seven areas: family and social environment, economic circumstances, health care, physical environment and safety, behavior, education, and health.
Highlights include:
- Family structure data — married and single parents, and foreign-born parents (Also available on kidsdata.org)
- Adolescent birth rates (Also available on kidsdata.org)
- Child abuse rates (Also available on kidsdata.org)
- Children with working parents
- Health insurance coverage (Also available on kidsdata.org)
- Housing cost and adequacy (Also available on kidsdata.org)
- Adoption data
Posted by kidsdata.org
Tags: Data Projects, Data Sources
California Ranks 16th in Annual KidsCOUNT Data Book
The state of California ranks 16th in the 2011 KidsCOUNT Data Book, an annual profile of the status of children, released this week by the Annie E. Casey Foundation. The Data Book ranks states on 10 measures of child well being, and California’s ranking this year is an improvement since last year’s rank of 19.
In fact, the 2011 Data Book shows improvements for California in many areas, including the number of babies born at a low birthweight, child and teen deaths, teen births, and teens ages 16-19 not in school.
Some areas, however, do not show improvement. Infant mortality rates have increased slightly in recent years, according to National KidsCOUNT indicators. Additionally, the number of children living in poverty and living in single-parent families has increased, the Data Book shows.
In order to address the impact of the recession on California children, this year’s Data Book includes two new indicators: the number of children affected by foreclosure, and households with at least one unemployed parent.
In California, nearly 1 million children have been affected by foreclosure since 2007. And, in 2010, 1.2 million California children had a parent who was unemployed. Overall, the economic well-being for low-income children and families in California has declined significantly in the past decade, according to the Data Book.
Visit kidsdata.org for additional data by county, city, school district, and legislative district>>
Posted by kidsdata.org
Tags: Data Projects, Data Sources
Another Use for Kidsdata.org: See the Status of Kids in Your County
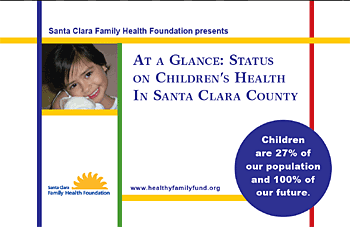 The Santa Clara Family Health Foundation’s data book “At a Glance: Status of Children’s Health in Santa Clara County” is an excellent example of how kidsdata.org can be used to facilitate discussions about child health issues.
The 40-page booklet includes data about birth rates, teen births, and immunizations from kidsdata.org, and many other topics from other data sources, including health coverage, water fluoridation, and mental health. While this booklet focuses on Santa Clara County, a similar report could be made for any county in California.
Kudos to the health foundation for creating a valuable snapshot of the status of child health in its county. This book is a useful reference for elected officials and other local policymakers. View the data book>>
Posted by Felicity Simmons
Tags: Data Projects, Data Sources
Brief Ranks CA Counties on Healthful Food Options
 A recent study by the UCLA Center for Health Policy Research shows that providing accessible, healthier food options where children live leads to healthier kids. The study focuses on the food environments in which teens live and go to school, and particularly on the amount of healthy and unhealthy food outlets available in those environments.
The brief measures the Home and School Retail Food Environment Index for each county. Healthful food outlets include grocery stores and produce vendors, and unhealthy food outlets include liquor stores, fast food restaurants, and convenience stores.
According to the brief, a majority of California counties have too many unhealthy food outlets and not enough healthy outlets in the vicinity of children and teens.
So how does your county fare? Overall, the county with the most healthful food options is Nevada County, whereas the county with least amount of healthful food options is Sutter County. See how your county fared in the study>>
Results are also broken down regionally. The Central Coast is the region with the healthiest food options, and the Sacramento area has the unhealthiest food choices. See how healthy your region’s food options are>>
On kidsdata.org, you can find related data on nutrition and children’s weight.
Posted by kidsdata.org
Tags: Child Health Issues, Data Sources
A New Look at the History of American Families
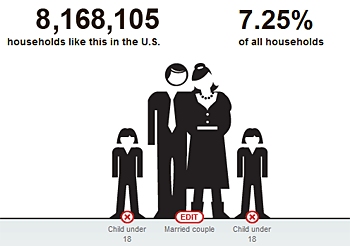 Have you ever wondered how many other families are just like yours?
This interactive tool from the New York Times analyzes census data since 1900, and shows the make-up of households in the U.S. For example, in 2009, about 8 million households in the U.S. consisted of a married couple with two children (about 7% of all households). That’s almost the exact same percentage as in 1900.
As for other types of families, the percentage of households with single women and two children increased from about .4% to 1.6% in the last century, and recent data indicate that more than 62% of those households has an income below $30,000. Male unmarried partners with one child make up about 17,000 households in the U.S., and unmarried female partners with one child account for about 30,000 households.
If you’re looking for more local data, kidsdata.org has data on family structure for cities, counties, and school districts across California, including single parent households, and children in the care of grandparents.
Posted by kidsdata.org
Tags: Data Projects, Data Sources
Now Available on Kidsdata: More Data About Kids with Special Needs
 |
| View a slideshow of data highlights from Children with Special Health Care Needs: A Profile of Key Issues in California |
Kidsdata.org has just added wide-ranging data — dozens of measures in all — on the approximately 1.4 million children in California who have a special health care need.
These new indicators are drawn in part from a just released study which found that California ranks at or near the bottom compared to other states on multiple measures of how well these children are faring. The report, Children with Special Health Care Needs: A Profile of Key Issues in California, was commissioned by our foundation and prepared by the Child and Adolescent Health Measurement Initiative.
On kidsdata.org, we now offer more than 80 measures of the health and well being of children with special health care needs at the state level with a U.S. comparison. These data include:
And some data related to children with special needs are available at a local level:
In an effort to bring together those working on issues affecting children with special health care needs, the foundation is establishing the California Collaborative for Children with Special Health Care Needs. The goal of the collaborative is to create a shared agenda and advocate for meaningful and lasting system change — including improving over the long-term measures of how these children are faring. Sign up to be a part of this work >>
Posted by kidsdata.org
Tags: Data Projects, Data Sources, New Data


