

Spotlight on Children With Special Health Care Needs (Part 5): 10 Ways Health Conditions Impact Kids and Families
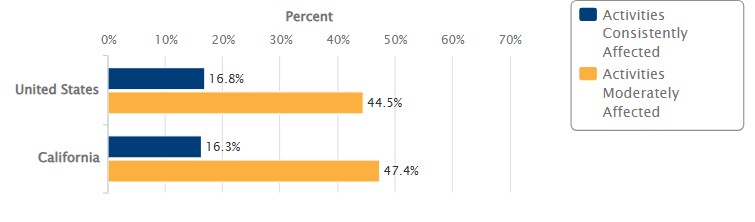
Percentage of Children With Special Health Care Needs Ages 0 to 17 Whose Conditions Affected Their Daily Activities in the Previous Year: 2023
This final installment in our series on children with special health care needs (CSHCN) describes medical, financial, educational, and personal difficulties many CSHCN and their families face. Check out our previous installments on quality of care, access to services, demographic and health characteristics, and family-centered care.
Nearly 1.5 million California children ages 0 to 17, and more than 15 million children nationwide, have special health care needs—meaning they need health and related services of a type or amount beyond that required by children generally due to chronic physical, developmental, behavioral, or emotional conditions. When this definition of children with special health care needs (CSHCN) is expanded to also include those with a diagnosed health condition and at least one functional difficulty, the numbers jump to 1.9 million statewide—22% of the child population—and nearly 19 million nationally.
For children who meet the narrower CSHCN definition, new estimates for 2023 highlight some of the impacts their ongoing health conditions can have, on themselves and on those close to them. Here are 10 indicators that paint a picture of daily life for CSHCN families—beginning with 5 that KidsData can now measure again for the first time in more than a decade:
1. More than 60% of CSHCN in California and the United States have conditions that moderately or consistently affect their ability to do the same things as other kids their age. Nationally, the share of publicly insured CSHCN whose conditions consistently affect their daily activities (22%) is twice as high as the share with private insurance (11%).
2. For California CSHCN who require therapies, medications, bandage changes, or other health care at home, more than a quarter have families who spend at least 11 hours each week providing that care.
3. More than 1 in 4 CSHCN in California visited the ER at least once in the previous year, and 1 in 10 had at least two visits. Statewide and nationally, ER visits are more common among CSHCN with public health insurance compared with those with private coverage.
4. Around 6% of California and U.S. CSHCN had an overnight hospital stay in the previous year. Among Hispanic/Latino CSHCN in California, the share was 4%; for white CSHCN, 8%.
5. Yearly out-of-pocket health care costs were higher than $1,000 for 22% of California CSHCN. Public health insurance programs kept costs manageable for many families—more than 95% of CSHCN with public insurance exclusively had out-of-pocket health costs of less than $500 in the previous year.
Updated data also point to greater challenges related to education and employment for CSHCN families:
6. The share of California CSHCN who missed 11 or more school days in the previous year due to illness or injury was 19%—around 5.5 times higher than the share of children without special health care needs.
7. The percentage of CSHCN who had ever repeated a grade in school—statewide (6%) and nationally (9%)—was more than double that for their peers.
8. An estimated 23% of CSHCN in California had parents or other family members who left a job, took a leave of absence, or cut back their work hours in the previous year because of the child’s health. Among CSHCN with more complex health care needs (those not managed primarily by prescription medications), the share was 27%.
9. For family members who continue working, health insurance often keeps them in their jobs. An estimated 18% of California CSHCN and 14% of CSHCN nationwide had someone in their family who avoided changing jobs in the previous year due to concerns about maintaining coverage.
10. Perhaps as a result of higher-than-average caregiving, economic, employment, and personal stress, parents of CSHCN are more frequently aggravated with their children than parents without CSHCN. Around 2% of children without special health care needs had parents who usually or always felt aggravation from parenting, compared with 20% of CSHCN.
Read more on KidsData about how policies and systems can promote the well-being of CSHCN and their families.
Health Data Resources
California ranks 32nd among states in overall child well-being, according to the Annie E. Casey Foundation’s latest KIDS COUNT Data Book—up from 35th in 2024. The state performed among the best in the health domain (11th) and among the worst for economic well-being (44th).
Social Determinants of Health Dashboards for Native Hawaiians and Pacific Islanders
The NHPI Data Policy Lab at the UCLA Center for Health Policy Research has launched state- and county-level data dashboards focused on the social determinants of health for Native Hawaiian and Pacific Islander communities.
Recently Released Data
We recently released data about impacts of special health care needs on children and families. See links to the latest here.
Posted by kidsdata.org
This entry was posted on Tuesday, June 17th, 2025 at 10:50 am. You can follow any responses to this entry through the RSS 2.0 feed. You can leave a response, or trackback from your own site.