Why Use Kidsdata.org? Let Us Count the Ways…
 Following the completion of kidsdata.org’s statewide expansion last summer, our foundation pointed out the top 5 reasons to use the site. This summer, in order to mark the one-year anniversary of the website going statewide, we’ll highlight each of those Top 5 — in no particular order — and share some examples of how kidsdata is being used to improve the lives of children across California.
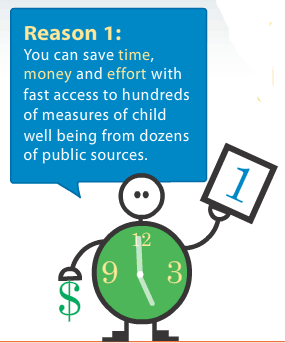
This week, we feature Reason #1 to Use Kidsdata.org — to save time, money, and effort. Ok, maybe that’s three reasons; but they’re all about using resources efficiently — something for which we all strive.
Why surf the web for hours looking for 10 different data points for a grant proposal when you may be able to find them all in one place? (Hint: that place is kidsdata.org) As a public service, we offer free access to data from more than 35 public data sources.
For example, the Central California Children’s Institute says they use kidsdata “almost on a daily basis to look for socioeconomic, health, safety and education data on children of the eight-county-wide San Joaquin Valley region.”
What a time-saver!
Has kidsdata.org helped you save time or money? Tell us about it!
Posted by Felicity Simmons
Post Comment
Data Updates: High School Dropouts and Homelessness
We recently updated two important measures of the well being of California students: homelessness and high school dropouts.
Data from ’09 on high school dropouts, from the California Department of Education, indicate that an estimated one in five public high school students in California (22%) will drop out at some point during high school. These data also are available at the county and school district level. Find data for your school district>>
The data show wide disparities among racial/ethnic groups. The lowest estimated dropout rates are for Asian American and Filipino students (about 10%). African American/Black, Native American, Hispanic/Latino, and Pacific Islander students have the highest estimated dropout rates, at or above 25%.
For homelessness, data are available at the state level and show that about 3% — or nearly 194,000 — public school students in grades K-12 were homeless in 2010. The data source, the National Center for Homeless Education, designates a student as homeless if their primary nighttime residence is a shelter, hotel or motel, a shared space with another family due to economic hardship, or no shelter. Learn more about these data>>
Posted by kidsdata.org
Post Comment
More Than Half of U.S. Babies Are Minorities, Census Estimates Show
Recent Census Bureau estimates of the 2010 census results show that for the first time in the U.S., minorities make up the majority of births. According to related ’09 census data, slightly less than half of children age 3 are non-Hispanic whites, compared to 60% in 1990.
Here in California, the percent of births to Caucasian/White mothers has been dropping steadily. In 1995, 36% of births were to Caucasian/White mothers, and by 2007, that dropped to 27% of births.
Posted by Jordan Handcox
Tags: Child Diversity
Study: Employer-Based Health Coverage Rates Falling Across U.S. — See Related Data for CA Children
According to a recent report from the State Health Access Data Assistance Center at the University of Minnesota, the rate of U.S. non-elderly workers with employer-based health insurance dropped 8 percentage points between 1999-00 and 2008-09, from 69% to 61%. Low- and moderate-income families were affected the most, according to the study.
In California, the study indicates that the percentage of employees with health coverage from their jobs fell from 62% in 1999-00 to 55% in 2008-09.
Related data on kidsdata.org from the California Health Interview Survey (CHIS) show that in 2009, 53% of California children ages 0-17 had employer-based coverage and about 43% were insured from other sources, leaving roughly 5% uninsured. According to the CHIS data, the percentage of children with employer-based coverage has decreased since 2001.
Posted by kidsdata.org
Post Comment
Santa Clara County Supervisors Vote to Make Use of Child Impact Statements
 Given our foundation’s mission to elevate the priority of children’s health, it’s encouraging to see that the Santa Clara County Board of Supervisors has taken steps to consider the impact its decisions have on the county’s 430,000 children.
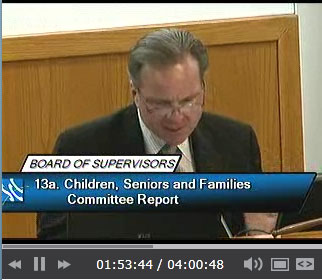
On June 21, the Board voted to adopt Child Impact Statements as part of every decision, beginning July 1. Proposed by Supervisor Dave Cortese as part of his Year of the Child initiative for 2011, these impact statements will help supervisors consider implications of given policies on children and youth.
To hear the Board’s vote, and accompanying support statements, watch the video.
See data about Santa Clara County kids at http://www.kidsdata.org/santaclara.
Posted by kidsdata.org
Post Comment
Allergies May Affect More Kids Than Thought — See Related CA Data for Kids with Special Needs
You may have seen the study released this week noting that nearly 6 million U.S. children have food allergies — more than some previous research suggested. According to this article in the Los Angeles Times, a recent study of 38,000 children, conducted by the Northwestern University Feinberg School of Medicine, found that many children suffer severe reactions from allergies, and that many are allergic to more than one food.
Among children with special health care needs in California, nearly half (48%) have allergies (of any type — not only food), according to 2005-2006 data. For more data on California’s children with special health care needs, visit http://www.kidsdata.org/cshcn.
Posted by kidsdata.org
Tags: CSHCN
A New Look at the History of American Families
 Have you ever wondered how many other families are just like yours?
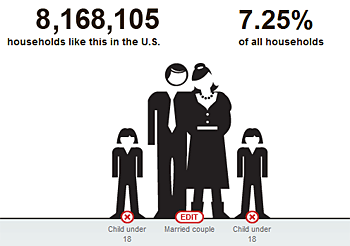
This interactive tool from the New York Times analyzes census data since 1900, and shows the make-up of households in the U.S. For example, in 2009, about 8 million households in the U.S. consisted of a married couple with two children (about 7% of all households). That’s almost the exact same percentage as in 1900.
As for other types of families, the percentage of households with single women and two children increased from about .4% to 1.6% in the last century, and recent data indicate that more than 62% of those households has an income below $30,000. Male unmarried partners with one child make up about 17,000 households in the U.S., and unmarried female partners with one child account for about 30,000 households.
If you’re looking for more local data, kidsdata.org has data on family structure for cities, counties, and school districts across California, including single parent households, and children in the care of grandparents.
Posted by kidsdata.org
Tags: Data Projects, Data Sources
Public Data’s New-Found Freedom
 The author of the emancipation proclamation for health data.
That’s what Matt Miller, host of NPR’s “Left, Right & Center,” dubbed Todd Park at a national Health Data Initiative Forum in Bethesda, MD on June 9.
Park, chief technology officer for the U.S. Department of Health and Human Services (HHS), was instrumental in making HHS’s wide-ranging data offerings much more accessible, and is a pivotal figure in the federal government’s open data initiative.
Miller’s emancipation theme was pervasive at this one-day, Institute of Medicine forum. Speakers noted that at last year’s inaugural conference, technologists, communicators, and policymakers were trying to make sense of what to do with public data’s new-found freedom.
 In just one year, Miller noted, numerous mature apps have emerged that utilize health data from the federal government in innovative and important ways. Many of these were featured at the forum, including Ozioma, which makes cancer-related data available to media; the Foodborne Disease Outbreak Investigation System, a public-private collaboration to investigate disease outbreaks; and Asthmapolis, which provides real-time data on asthma by tracking when – and where – people use their inhalers.
But while there are reasons for optimism, there were some pointed reminders, too, about the need to focus even more on how best to use all the data the federal government is releasing. For example, Harvey Fineberg, president of the Institute of Medicine, quoted Samuel Coleridge’s famous quote, “Water, water every where, nor any drop to drink.” Noting that “we’re “afloat in a sea of data,” Goldstein said that “information shall set you free, but only if you can use it.”
HHS Secretary Kathleen Sebelius pointed out that 30 years ago, “You often had little data; you made policy by anecdote.” Today, the situation is the same, she said, urging attendees to use data to help improve both health care costs and outcomes.
To help organize the burgeoning national interest in health data, HHS, the Institute of Medicine and the Robert Wood Johnson Foundation announced the formation of a national Health Data Consortium to help the country understand the power of health data and harness these data to make the U.S. a healthier nation. In addition to the organizations above, some of the other 15 founding members of the Health Data Consortium include our foundation, the California Health Care Foundation, Consumer Reports, Grantmakers in Health, and the National Association of Counties.
Posted by Andy Krackov
Tags: Data Challenges, Data Projects
New Test for Down Syndrome Raises Ethical Concerns
A recent AP article, “Comfort or Conflict: Earlier Down Syndrome Test,” explores the ethical challenges posed by a new type of DNA test for Down syndrome. In the near future, DNA tests for Down syndrome may be available as a simple blood draw, and the new tests could give parents accurate results earlier in the pregnancy than with amniocentesis or chorionic villus sampling (CVS).
The article notes that this new test raises complex ethical concerns, because a Down syndrome diagnosis before birth can “pose a difficult challenge for couples as they decide whether to continue the pregnancy,” according to Dr. Mary Norton, director of Perinatal Research at Lucile Packard Children’s Hospital.
A recent study concluded that advances in testing (and, thus, more options for would-be parents during pregnancy) have contributed to an 11 percent decline in Down syndrome births in the U.S. between 1989 and 2006, a time during which rates were expected to rise 42 percent.
In California, about 1% of all children with special health care needs have Down syndrome, according to 2005-06 survey data, the most recent time period for which data are available.
Posted by Jordan Handcox
Tags: Child Health Issues, CSHCN
Racial/Ethnic Disparities in Children’s Weight Persist
Given public attention to weight issues among children, some might assume that there are fewer kids these days at a healthy weight than 10 years ago. When examining California data for 5th, 7th and 9th graders in public schools, however, it’s striking that most of the trend lines are fairly flat. In 1999, for example, 67% of California 5th graders were at a healthy weight. Roughly 10 years later, in 2010, that percentage was similar, at about 69%.
While the data indicate that weight trends among public school kids in these grades may not be getting worse, at least as measured by this indicator, neither have they gotten discernibly better over the last 10 years.
What also hasn’t budged much are racial/ethnic disparities in children’s weight. Across 5th, 7th, and 9th grade in 1999, there was roughly a 20 percentage point difference between the racial/ethnic groups in California that had the lowest and highest percentage of students at a healthy weight. In 2010, that percentage point spread was at about 23, slightly greater than in ‘99.
That there are racial/ethnic disparities in children’s weight is not surprising. The data reveal just how intractable these disparities have proven to be over the past decade. In 1999, for example, 74% of Caucasian/White 9th graders were at a healthy weight, compared to 59% of Pacific Islander 9th graders. In 2010, that gap had widened – about 80% of Caucasian/White 9th graders in California at a healthy weight, compared to 59% of Pacific Islander youth in this grade.
One key step in addressing these disparities is continuing to monitor the data and raise awareness about the issues. Understanding what works, especially in this tough budget climate, is another essential step. Numerous organizations and individuals have been working hard for many years to address these disparities and improve children’s weight, overall. For more information about key organizations, research on this topic, and strategies to address these complex issues, see kidsdata’s Research & Links section and a summary of policy implications.
If you have insights to share on this subject, please post a comment here.
Posted by kidsdata.org
Tags: New Data


