Data Report Paints Bleak Picture of the ‘State of America’s Children’
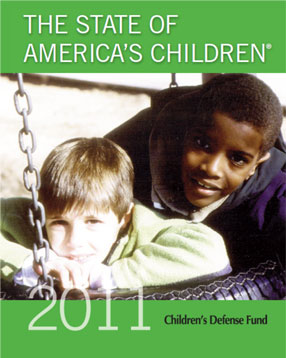 The Washington D.C.-based Children’s Defense Fund (CDF) recently released a report, The State of America’s Children 2011, which illuminates striking differences between the U.S. and other industrialized countries in terms of child health and well being. In addition, the report presents state-level data for a variety of important indicators related to poverty, family structure, nutrition, juvenile justice, and gun violence.
According to the report, the U.S. ranks first in gross domestic product (GDP), first in the number of billionaires, and first in military technology. However, the U.S. ranks 30th in infant mortality, 31st in math scores, and last in teen birth rates.
Despite having the highest GDP in the world, the Census Bureau estimates that one in every five children in America is living in poverty. The numbers are the same here in California – 20% of children lived in families with incomes below the federal poverty level, according to 2009 data. In addition, more than half of California students are poor enough to qualify for free or reduced price school meals.
Read more about the report or download the PDF version at http://www.childrensdefense.org/child-research-data-publications/data/state-of-americas-children-2011-report.html.
Posted by Jordan Handcox
Post Comment
Top 5 Reasons to Use Kidsdata.org: Reason #4 – Share Your Data
 Once you’ve found the exact data you need on kidsdata.org – and customized it how you want – there’s no need to keep it all to yourself, right? After all, with kidsdata.org, our foundation’s goal is to help promulgate data about how kids are faring, in order to help elevate the visibility of children’s issues in California.
So reason number 4 of the top 5 reasons to use kidsdata.org? You can share your results instantly using the tools in the top right corner of every data page.
For whatever data you’ve chosen, you can copy your customized graph or chart into a Word document or Powerpoint slide. Or, you can download the data directly into Excel – either just the data you’re looking at or the entire dataset – to create your own graph.
And, you can share the graph you’ve created with your friends and colleagues instantly via Facebook, Twitter, bookmarking sites such as Digg and Reddit, or via e-mail.
Finally, using the “<embed>” button, you can take a customized graph from kidsdata.org and put it directly on your website. Then, the graph on your site will automatically update when we add new data to kidsdata.org.
For example, this blog post on greatschools.net uses an embedded graph from kidsdata.org to show the rise in autism diagnoses over time.
Posted by Felicity Simmons
Post Comment
A Looming Threat to Public Insurance Programs for Children with Special Health Care Needs
Negotiations now under way in Washington, DC, regarding the U.S. debt ceiling could have a catastrophic effect on some of California’s children with special health care needs and their families.
Many children in our state depend on public health insurance programs to meet all or part of their health care costs, through Medi-Cal (California’s Medicaid program) or Healthy Families (California’s State Children’s Health Insurance program). The State Flexibility Act, currently under debate in Congress in conjunction with the debt negotiations, would reduce spending and allow states to make cuts in eligibility for these vital programs. Potential scenarios for California could include complete elimination of Healthy Families, and limits placed on the number of children eligible for Medi-Cal.
Such changes would have a particularly negative effect in California, where more than a third of California’s children with special health care needs already have insurance that is not adequate to meet their requirements, according to Children with Special Health Care Needs: A Profile of Key Issues in California, a report commissioned by our Foundation. Our state ranks 46th out of the 50 states on adequacy of insurance for children with special health care needs, the report notes.
The Medicaid and Healthy Families programs have contributed substantially to improving the health and well being of children, and these programs are especially critical for children with complex and chronic conditions. A new study from Georgetown University’s Center for Children and Families documents how much is at stake if these programs are cut or lost. Without insurance, children may lose access to primary care, specialists, early intervention programs, or preventive services that help keep their conditions from worsening. Medicaid also helps many children live and be cared for in their homes and communities rather than in institutions.
Attempts to alter these essential public insurance programs have been made before. This time around, however, the crisis is so severe that some supporters in Congress are pessimistic. In a recent Wall Street Journal article, Senator Jay Rockefeller (D-WV), a longtime Medicaid advocate said, “There has been an unsettling silence around Medicaid even from members of my own party.”
As the negotiations about reducing the national debt proceed, it is imperative that we add our voices to the debate. Let your Congressional representatives and the Obama Administration know what it means for children and families to lose access to the health care they deserve.
You can find your representatives at http://www.govtrack.us/congress/findyourreps.xpd, or call
(202) 225-3121 for the Capitol switchboard and (202) 456-1414 for the White House. Ask them to protect Medicaid and the State Children’s Health Insurance Program.
I also encourage you to join the new California Collaborative for Children with Special Health Care Needs, a statewide group developed by our Foundation that will be working toward a better system of care for children in California with special health care needs.
Posted by David Alexander, MD
Tags: Child Health Issues, CSHCN
Using Kidsdata for Storytelling
Originally posted on Health Databytes, the UCLA Center for Health Policy Research blog
 They say every picture tells a story. At the Lucile Packard Foundation for Children’s Health, we believe that every data point has the potential to tell a story. That’s why we operate our flagship website, www.kidsdata.org.
Kidsdata.org consolidates hundreds of indicators at the state, county, city, and school district level that help paint of picture of how children in California are faring. Data are drawn from the California Department of Education, the Census Bureau, the California Healthy Kids Survey, and dozens of other sources – including, of course, the California Health Interview Survey. The stories these data tell can be used to help bring attention to key children’s issues, and to support funding requests.
At the foundation, we’ve developed number of approaches – mostly through trial and error – for using data for storytelling. Here are some relatively low-cost tactics that have proven particularly effective for us.
• Tell a Story Yourself; Create a Data Slideshow. For a number of recent announcements about updated data on kidsdata.org, we’ve build simple data slideshows to summarize how children are faring for a particular topic, such as weight or child welfare. We like to make these slideshows visually compelling by showing data in multiple views – trend and pie graphs, maps, etc. – and we design them as high level, compact summaries of an issue.
Since we’ve begun to highlight these data slideshows in e-mail announcements about recently updated data, they’ve become the most clicked-on links. It’s not unusual for us to hear about people making use of these slideshows in their own work, such as an instructor who wanted to download the weight slideshow for use in an online class for California teachers.
• Localize the Data. While it’s not always easy to do, it pays to invest time to provide, or just link to, local data when you can. Websites like AskCHIS or kidsdata.org can help you accomplish this. We’ve found, for example, that our e-mails are more viral when we include direct links to data by school district. Similarly, when we meet with staff for elected officials, we prepare some graphs to show with data for their region.
 Through kidsdata.org, you can drill down to find the data you need at the specificity you desire, and once you do, you can download your graphs and tables for use in Word or PowerPoint, or even embed charts and maps into your own website or blog.
• Treat Data Storytelling as a Campaign, not a One-Time Mention. If you’re getting ready to communicate data from a study you’re releasing, or if you want to use data to support an advocacy position your organization is taking, think about how you can communicate these data in a sustained way, given that some key constituents may not necessarily pay attention at a particular moment. The story you’re telling with the data doesn’t need to be told all at once; sometimes installments can work well. With kidsdata, for example, we offer a fact of the day through Twitter, and journalists/policymakers sometimes retweet these facts to their audiences.
Know of other strategies? We encourage you to add them to this list.
Posted by Andy Krackov
Post Comment
Top 5 Reasons to Use Kidsdata.org: Reason #3 – Customize Your Data
 Reason number 3 in our countdown of the top 5 reasons to use kidsdata.org helps you get exactly what you want. Customize.
On kidsdata.org, you can tailor the data to reflect the region, year, and/or demographic breakdown relevant to you or the kids you are serving. Depending on the source, data are available by age, gender, grade level, racial/ethnic group, or socioeconomic status.
Want to know the percentage of 9th grade Asian American students in your school district who are at a healthy weight? Or how many low-income third graders are proficient in reading? Kidsdata.org can tell you.
And once you’ve drilled down to find what you’re looking for, you can view your results as maps, bar graphs, pie charts, tables, or trends over time. All the tools you need to tell your story — right at your fingertips.
Posted by Felicity Simmons
Post Comment
Data Updates: Injury Hospitalization and Self-Inflicted Injury Rates
We recently updated two related measures of children’s health and well being – injury hospitalizations and self-inflicted injuries. Following are some highlights about what these data tell us about how kids in California are faring:
- 2009 data from the California Department of Public Health show that, for California children/youth ages 0-20, the rate of hospitalizations for non-fatal injuries has generally declined since 2000. Unintentional injuries account for the vast majority (almost 75% in 2009) of the total number of injuries, and injury hospitalization rates vary greatly among California counties, from about 150 per 100,000 kids/youth to more than 400 in 2009. Learn more about these data>>
- The rate of youth self-inflicted injury hospitalizations in California also has dropped since 2000. County-level rates varied from about 19 per 100,000 children/youth ages 5-20 to more than 60 per 100,000 in 2009. Learn more about self-inflicted injuries>>
- Injury hospitalizations, whether self-inflicted or due to other causes, are most common among youth ages 16-20.
Posted by kidsdata.org
Post Comment
Government Plans to Collect Health Data on LGBT Population, Improve Data Collection Standards
 The Department of Health and Human Services recently announced that it will begin collecting data on lesbian, gay, bisexual and transgender (LGBT) populations, to better understand and address health disparities. The department also announced new draft standards for collecting and reporting data on race, ethnicity, sex, primary language and disability status. According to HHS Secretary Kathleen Sebelius, “The data we will eventually collect in these efforts will serve as powerful tools and help us in our fight to end health disparities.” The race/ethnicity standards, for example, will improve data collection for various racial and ethnic subgroups, especially among Asian, Hispanic/Latino and Pacific Islander populations.
Posted by kidsdata.org
Post Comment
Snapshot of Teen Substance Abuse in CA
See this recent article on teen alcohol and drug use in the U.S.
Here in California:
- Nearly 40 percent of male 11th-graders say they have tried marijuana at least once in their lifetime. Just over one-quarter report that they have tried it four times or more.
- 37 percent of 11th-grade girls reported drinking alcohol in the past 30 days.
- Nearly one-third (31%) of 11th grade boys reported ever smoking a cigarette.
- Statewide, about 20% of 11th grade girls and 24% of 11th grade boys reported binge drinking at least once in the past 30 days.
These data come from the 2006-2008 California Healthy Kids Survey (WestEd). Find more data on alcohol, tobacco, and other drugs on kidsdata.org.
Posted by Jordan Handcox
Post Comment
Top 5 Reasons to Use Kidsdata.org: Reason #2 – Get Local
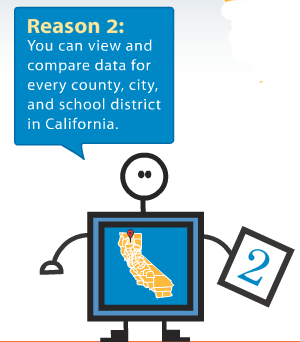 This week, we continue counting down the Top 5 reasons to use kidsdata.org with an emphasis on the local data available on the site.
County data are good, but city and school district data are even better. On kidsdata.org, we have all three — with statewide comparisons, of course. Better yet, you can compare these local regions to each other to see how children in your community are faring vs. another locale, or any set of regions that you choose.
An example of putting local data into action comes from the Beaumont Unified School District in Riverside County, who reported using kidsdata.org when visiting the Legislative Action Committee for Child Nutrition in Washington, D.C., to give legislators “a snapshot of our district.”
Here’s a sampling of just some of the data on kidsdata.org that are available at a very local level:
- Child population, family structure, immigration, family income, and poverty for regions of 20,000 residents or more.
- College readiness, high school dropouts, math proficiency, and more education data, available by school district.
- Emotional and behavioral health data including alcohol and drug use, dating violence, gang involvement, bullying, depression, and much more, available by school district.
How have you made use of the local data on kidsdata.org for your region?
Posted by Felicity Simmons
Post Comment
Raising Kids in Tulare County: How Are We Doing?
 This guest post is by Kalyn Gereg, administrative specialist with the Tulare County Health and Human Services Agency
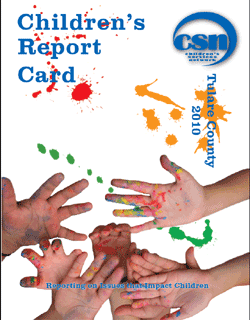
Recently released by the Children’s Services Network of Tulare County, the Children’s Report Card presents data on 24 demographic, economic, and health-related indicators, providing a synopsis of the status of children and families in this Central Valley county. Four generalized outcome areas are represented, including health indicators for children and youth; school readiness of younger children; economic self-sufficiency of families; and family and community safety.
The Children’s Report Card shows that Tulare County is doing better in several areas, but many challenges remain. The rate of births to teens in Tulare County has been far above the state rate for several years; however, a decrease in recent years is a notable improvement. Other areas of improvement include physical fitness levels, number of children in foster care, and children with required immunizations.
The purpose of the Children’s Report Card is to inform and educate the community; to raise awareness of the need for targeted interventions to improve outcomes; and to highlight “promising practices” contributing to improved outcomes. Data reports such as these help policymakers, funders, service providers, and community leaders make informed decisions regarding planning and implementing services throughout the community.
Please read the full report on the Children’s Services Network of Tulare County website, http://www.tccsn.org. See a profile of data about children in Tulare County on kidsdata.org at http://www.kidsdata.org/tulare.
Posted by kidsdata.org
Post Comment


