Orange County Workshop: Using Children’s Health Data in Your Work
 Attention everyone in Southern California who need children’s data for their work!
On Friday, Sept. 30, in Anaheim, we’re partnering with the UCLA Center for Health Policy Research and their HealthDATA team for a day-long workshop about finding and using data.
At this FREE workshop, you’ll learn how to formulate data questions, interpret results, export data for analysis, and use your findings in reports, presentations, proposals, and policy/program planning. Working directly with kidsdata.org, attendees will learn simple tips for obtaining health information for every city, legislative district, county, and school district in the state.
For more details, and to register, visit http://www.kidsdata.org/content/ucla-orange/Default.aspx
Posted by kidsdata.org
Tags: Data Projects, News About Kidsdata.org
Roseville Boy’s Story Rings True for Many Families of Children with Special Health Care Needs
Sometimes a story can help make data seem more real – and that’s certainly the case with Justin Caldwell, a 12-year-old boy from Roseville, CA, who has been afflicted with dilated cardiomyopathy, or an abnormally enlarged heart, since he was eight months old. Justin now awaits a new heart transplant at Lucile Packard Children’s Hospital. His battle and that of his mother, Katie Caldwell, echoes that of many families who have experienced the economic and emotional stress of having a child with a special health care need.
While Justin is on standby for a heart transplant in Palo Alto, his mother remains at his side and has been unable to work at her job in Roseville. Unfortunately, the financial insecurity that Justin’s family is undergoing now is not uncommon for families of children with special healthcare needs.
2005-2006 data on the impact of a child’s special health care needs on parental employment shows that 24% of California parents of children with special health care needs had to cut back or stop working to care for their child. Similarly, 2007 data show that a higher percentage of parents of children with special health care needs report stress as a result of parenting (27%) than parents of children without special needs’ (13%).
See more about how special healthcare needs impact families in California >>
Posted by kidsdata.org
Tags: CSHCN
New Census Data: More Than 1 in 5 American Kids Live in Poverty
 A new report released today by the Census Bureau notes concerning increases in child poverty from 2009 to 2010 across the country.
According to the report, Income, Coverage and Health Insurance in the United States: 2010, 22% of U.S. children lived in poverty in 2010 — that’s up from 20.7% in ’09, which translates to nearly 1 million more children in poverty. Also, in 2010, 9.8% of U.S. children were uninsured, but among children in poverty, the percentage was higher, at 15.4%.
The report is particularly timely, given that tomorrow we’ll be participating in a New America Media briefing about childhood poverty. The event will illustrate the challenges faced by low-income youth and families in the Bay Area from several different perspectives.
Here are a few other highlights of the census report:
- Annual median income levels in U.S. family households declined from $62,276 in 2009 to $61,544 in 2010 (Table 1, pg. 6)
- Households in the West experienced a greater decline in median household income than any other region across the country — 2.9% (Table 1, pg. 6)
Visit kidsdata.org for additional data on poverty, health care, and family income for your region.
Posted by kidsdata.org
Tags: Child Health Issues, Data Sources
Join Us for a Media Forum: Growing Up Poor in the Bay Area
 As the number of California children living in poverty has risen in recent years, key programs serving children and families have been cut. A media forum planned for next week aims to address these issues — and hopefully spur action.
The New America Media forum, Growing Up Poor in the Bay Area, will be held on Wednesday, Sept. 14, from 10:30 a.m. to 1 p.m. in San Francisco, and is sponsored by the Lucile Packard Foundation for Children’s Health. This event will feature information about youth poverty from several perspectives:
- A presentation of local poverty data on kidsdata.org;
- Multimedia stories from youth reporters who will translate these data into real lives, describing how they’ve seen poverty affect local youth; and
- Comments/discussion from youth development organizations and others about troubling trends and recommendations for action.
We hope that this forum will help illustrate challenges faced by low income youth and families — and perhaps inspire some media coverage of these issues. Stay tuned to Data Points for a re-cap of this event.
If you’d like to attend Wednesday’s event, contact Dana Levine at [email protected] or 415-503-4170.
Posted by kidsdata.org
Tags: Child Health Issues, Data Projects
Some Data Now Available by Legislative District
 This week, we added a range of demographic and economic data for every Congressional, Assembly, and State Senate district in California — nearly a dozen measures of child health — to kidsdata.org. (See the data we added)
Our colleagues across the state tell us that local data help them the most — and the more local the better. On kidsdata.org, we already offer data for many topics at the city and school district level. The addition of data by legislative district means we can show data for many more regions across California — over 1,800 in all. In addition, we’ve heard from elected officials and their staff that hard data for their district would help them do their jobs better. By providing these data, we hope to help fill that need.
Currently, there are more than 400 measures of child health available on kidsdata.org. So, why are so few available by legislative district? The short answer: Only some data are collected that way. These legislative data, in fact, are drawn from recently posted data from the Census Bureau’s American Community Survey; these data weren’t even available a year ago. We hope this addition to kidsdata.org helps policymakers improve the lives of children in their districts.
Another site that offers data by legislative district, for both children and adults, is Healthy City. If you know of other resources, or other data available by legislative district, please note them below.
Posted by kidsdata.org
Tags: Data Challenges, New Data
New Presentations Help Journalists, Others Use Census Data
 As results from the 2010 Census are released, the need for tools to help wade through all these data is becoming clear. To help address this, Arizona State University and the McCormick Foundation funded experts to create 40-minute how-to presentations to assist journalists and the public in using specific Census data. The presentations include information on comparing data among regions, using online maps, and analyzing trends. These presentations were featured in a recent Policy for Results blog.
Posted by kidsdata.org
Tags: Data Projects, Data Sources
The Minority Becomes the Majority: Mapping a National Trend
As we noted in a blog post last week, there have been notable shifts in the racial/ethnic composition of California’s public school students over the past two decades. In particular, Hispanic/Latino students recently became a majority in California schools.
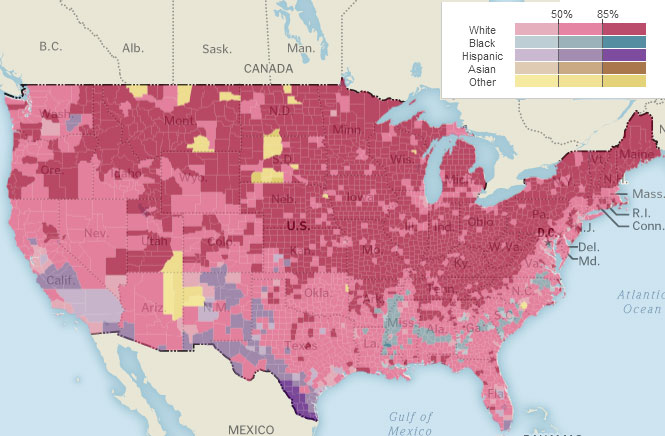
Recent census data analysis suggests that this shift is a national trend, too. According to this Washington Post article, minorities are a majority in 22 of the nation’s 100 largest metro areas. Of those 22, nearly half are in California, including San Jose, Stockton, Bakersfield, Los Angeles, and San Francisco. (See this intriguing infographic for a more detailed breakdown.)
The census data map below, developed by the Washington Post, shows population by race/ethnicity for every county in the U.S., as well as the percentage change over time, by racial/ethnic group, population density and family type. Click on the map to find data for your community. On kidsdata.org, you can see local school district enrollment data for the metro areas noted in the article, as well as data for all other school districts in California.
Posted by kidsdata.org
Tags: Child Diversity
Health Observances for September: Cancer, Suicide Prevention, and More
 September is a busy month for health observances. Following is a partial list with accompanying data from kidsdata.org.
Fruits and Veggies- More Matters Month
National Childhood Obesity Awareness Month
- The percentage of California 5th and 7th graders at a healthy weight (69% for both in 2010) has held fairly steady over the past decade, while the percentage of 9th graders at a healthy weight improved slightly, from 65% in 2002 to 71% in 2010.
Childhood Cancer Awareness Month
- According to 2002-2006 data, leukemia was the most commonly diagnosed type of cancer in CA children ages 0-19, with a rate of 4.9 per 100,000.
- 16 of every 100,000 CA children were diagnosed with cancer, according to 2002-2006 data.
National Infant Mortality Awareness Month
- 5.2 of every 1,000 infants died before their first birthday in CA, according to 2005-2007 data.
National Alcohol and Drug Addiction Recovery Month
- Data from 2006-2008 show that a higher percentage of CA male vs. female 7th graders report that they don’t use drugs (64% vs. 52%), but by 11th grade, the opposite is true: a higher percentage of female vs. male 11th graders report that they don’t use drugs (71% vs. 67%).
National Suicide Prevention Week
- Overall, youth suicide rates in CA are trending downward. The state’s youth suicide rate in 2005-07 was 6.9 per 100,000 youth ages 15-24, substantially lower than the rate of 9.4 in 1995-97.
Posted by kidsdata.org
Tags: Health Observances
Long-Term Growth in CA’s Public School Enrollment Masks Recent Declines
The take-home message from this accompanying graph of public school enrollment in California may seem to be the overall rise in California’s student population from 1994 to 2011. Last school year, California’s public schools enrolled 6.2 million students, which is about 1 million more students than in 1994. That’s an 18% increase.
At closer examination, however, the slight decrease from 2005 to 2011 is also a noteworthy trend. Across California, there were about 105,000 fewer students enrolled in public schools last school year than in 2005. And of 1013 school districts with both 2005 and 2011 data, more than half enrolled fewer students last school year than they did in 2005 (see data for your school district). 60% of counties experienced enrollment declines, too; rural counties were the hardest hit with enrollment declines.
In general, as school enrollment decreases, so does average daily attendance (ADA). Declines in ADA result in decreased per pupil funding from the state.
Some other noteworthy facts from the public school enrollment data recently updated on kidsdata.org:
- According to 2011 data, more than half (55%) of California’s public school students are in five Southern Californian counties (Los Angeles, Orange, San Diego, Riverside, and San Bernardino).
- In the ’10-’11 school year, Los Angeles County alone made up over 25% of public school enrollment for California; on its own, the Los Angeles Unified School District made up over 10%.
- From 1994 to 2011, enrollment growth was particularly notable in two counties – Placer (74%) and Riverside (69%).
Posted by Andy Krackov
Tags: New Data
California’s Changing Demographics Mirrored in School Enrollment Trends
Last school year, more than half (51%) of students in California’s public schools were Hispanic/Latino. But this hasn’t always been the case; Hispanic/Latino students only recently became a majority of California’s public school population.
Over the past two decades, in fact, we’ve seen notable shifts in the racial/ethnic composition of California’s public school students, as evidenced by this graph (click the bar graph tab, then press play).
Here in California, about three out of every four students in public schools are students of color. As noted, more than half of these students were Hispanic/Latino in 2011, up from 37% in 1994. By comparison, the proportion of students who were Caucasian/White dropped from 42% in 1994 to 27% in 2011.
Map Racial/Ethnic Enrollment Data for Your Community
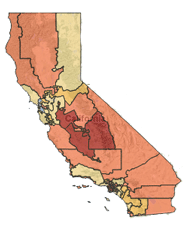
Following are maps providing local-level data on public school enrollment in California. In each map, you can use the “Show Regions” menu to toggle between school district and county-level data.
- African-American/Black Students
In California, Solano County (17%) and Alameda and Sacramento counties (both at 14%) had the largest percentage of African American/Black public school students last school year. See map >>
- Asian-American Students
Among California counties, San Francisco (39%) and Santa Clara (27%) had the largest percentage of Asian American public school students last school year. See map >>
- Caucasian/White Students
The California counties where 60% or more of students are Caucasian/White all are in Northern California, according to data from last school year. See map >>
- Filipino Students
Among California counties, Solano (9%), San Mateo (8%), and San Francisco (5%) had the largest percentage of Filipino public school students last school year. See map >>
- Hispanic/Latino Students
Among California counties, Imperial (89%) and Monterey (74%) had the largest percentage of Hispanic/Latino public school students last school year. See map >>
- Multiracial Students
Multiracial students make up 1.8% of public school students in California, according to 2011 data. See map >>
- Native American/Alaskan Native Students
Across California, there were 43,546 Native American/Alaskan Native public school students last school year. See map >>
- Pacific Islander Students
San Mateo County had the largest percentage of Pacific Islander public school students in 2011 (2.5%). See map >>
Posted by Andy Krackov
Tags: New Data


