The Minority Becomes the Majority: Mapping a National Trend
As we noted in a blog post last week, there have been notable shifts in the racial/ethnic composition of California’s public school students over the past two decades. In particular, Hispanic/Latino students recently became a majority in California schools.
Recent census data analysis suggests that this shift is a national trend, too. According to this Washington Post article, minorities are a majority in 22 of the nation’s 100 largest metro areas. Of those 22, nearly half are in California, including San Jose, Stockton, Bakersfield, Los Angeles, and San Francisco. (See this intriguing infographic for a more detailed breakdown.)
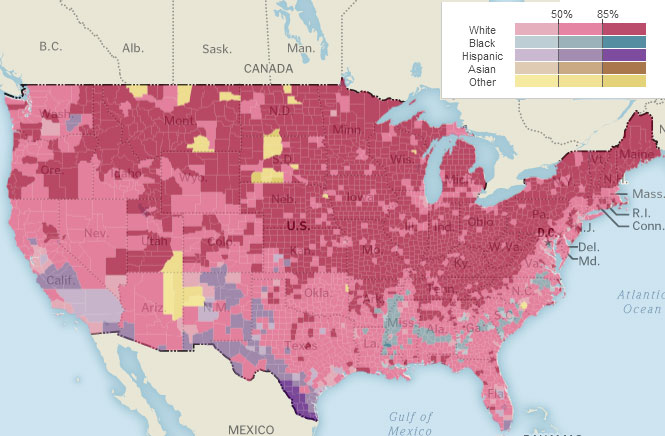
The census data map below, developed by the Washington Post, shows population by race/ethnicity for every county in the U.S., as well as the percentage change over time, by racial/ethnic group, population density and family type. Click on the map to find data for your community. On kidsdata.org, you can see local school district enrollment data for the metro areas noted in the article, as well as data for all other school districts in California.
Tags: Child Diversity
Posted by kidsdata.org
This entry was posted on Tuesday, September 6th, 2011 at 11:20 am. You can follow any responses to this entry through the RSS 2.0 feed. You can leave a response, or trackback from your own site.


