

Newly Re-designed Family Structure Topic

Learn more about California children’s living arrangements by visiting our re-designed Family Structure topic. New and updated data include expanded information about family demographics and housing situations:
- Households with and without children
- Dual-parent and single-parent households
- Cohabiting, same-sex and grandparent-led households
- Housing situation such as living in a friend’s home or motel
The first three sets of data are available for counties, cities, school districts, and legislative districts. The last set of data is available by race/ethnicity and other breakouts.
No matter the family configuration, having at least one reliable and supportive connection with an adult is associated with positive long-term emotional and physical health outcomes for children. A vulnerable population that may be at particular risk of lacking this connection are youth who do not live with parents or other relatives in a stable home environment. About 10 percent of California 7th graders in 2015-2017 did not live in their parents’ or other relatives’ home. Programs and policies that foster relationship development, from promoting responsible fatherhood to expanding home visiting programs, help ensure that all children have a safe and stable home environment.
Additional Resources
The Fred Rogers Center, a legacy of Mr. Rogers, provides research-based tools to capitalize on the power of simple interactions in caring relationships between children and caregivers.
Recently Released Data
We recently released data about Family Structure and Intimate Partner Violence. See links to the latest here.
Posted by kidsdata.org
Post Comment
Obesity Rate Remains High for California Kids
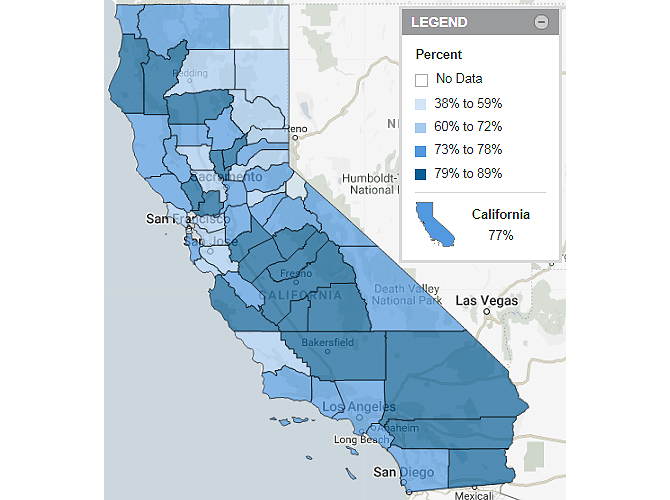
5th Grade Students Who Are Overweight or Obese, 2018
The latest data from 2018 show that 41% of 5th graders in California were overweight or obese. Particularly troubling are the large race/ethnicity disparities, including 54% of Native Hawaiian/Pacific Islander and 49% of Hispanic/Latino 5th graders that were overweight or obese, as compared to fewer than 30% of their Asian American and white peers.
Consistent with these findings, the percentage of children who met the California Department of Education fitness standards also showed disparity by race/ethnicity. Fewer than 20% of Native Hawaiian/Pacific Islander and Hispanic/Latino 5th graders met all fitness standards compared with 35% of Asian American and white students.
Reducing childhood obesity rates requires more than personal effort. Public policies are necessary to ensure equitable access to opportunities for physical activity in and out of school, and affordable healthful foods, among other factors. As the state continues to advance anti-obesity policies, we must ensure that these efforts effectively address racial/ethnic and other inequities, engage local communities in solutions, and utilize strategies that are culturally and linguistically appropriate.
Additional Resources
Learn more about California’s approach to addressing childhood obesity.
Foundation News: Dr. Edward Schor to Retire
Edward Schor, MD, who for the past eight years has led work at the Lucile Packard Foundation for Children’s Health to promote children’s health in California and improve the system of care for children with special health care needs, will retire July 2. Read Dr. Schor’s reflections on the Foundation’s progress towards elevating the priority of children’s health and how to continue creating a system that works for children and families.
Recently Released Data
We recently released data about weight and physical fitness. See links to the latest here.
Posted by kidsdata.org
Post Comment
Our Impact on Children’s Health in California
Early in 2019, the Public Health Institute Survey Research Group conducted a survey to help the Lucile Packard Foundation for Children’s Health better serve the field and assess the impact of the Kidsdata program on improving children’s health and well-being. We are grateful to the 198 respondents who shared their opinions and comments. Your feedback will apprise our Foundation and inform Kidsdata’s future activities. Some key findings are below, and others will be shared in future issues of Kidsdata News. You can access the full report here.
Elevating the priority of children’s health
Over half of respondents use kidsdata.org for presentations, community planning and writing reports. More than four out of ten use it for grant proposals and evaluating community outcomes. Respondents also shared that kidsdata.org has helped with regional disaster planning, constituent outreach, training health professionals, and quality improvement projects.
Using data for action
Over one-third of respondents were from a non-profit or other organization and another one-third were from a state, county, or city agency. Nearly every respondent indicated that Kidsdata has increased public awareness of issues related to children’s health and well-being in California (99%). An educator shared, “Kidsdata allows me to advocate for positions in an informed way.”
Looking ahead
The Kidsdata staff are dedicated to supporting your data and information needs so that you can devote your efforts to shaping children’s environments and experience and thus maximizing their health and development. We hope these survey findings will help you learn new ways to make the most of kidsdata.org in your work on behalf of children. As always, if you have feedback, please share with us at [email protected].
Recently Released Data
We recently released data about gang involvement. See links to the latest here.
Posted by kidsdata.org
Post Comment
Affordable Housing is Critical to Children’s Health
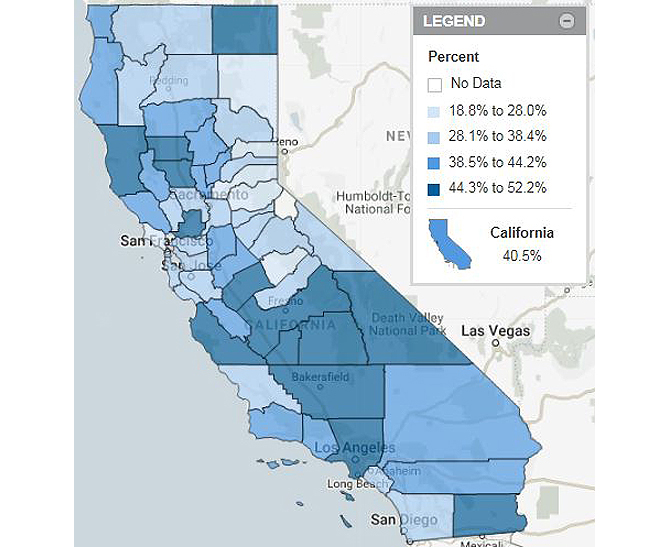
Households with a High Housing Cost Burden: 2013-2017
California housing is among the most costly in the nation, so finding affordable housing is a significant challenge for many middle- and low-income families. In 2013-2017, an estimated 43% of California households were housing cost-burdened, meaning households spent at least 30% of income on housing.
As the state grapples with affordable housing, it is important to remember how it impacts children in California. A lack of affordable housing can lead to housing instability and crowded households, thus affecting a child’s social development and educational outcomes, from disrupting friendships and social support networks, to inconsistent school experiences and classroom instruction. Additionally, residential overcrowding has been linked to the prevalence of certain infectious diseases and psychological distress. Providing stable and quality housing is critical to positive health outcomes for children.
Additional Resources
A report from the Public Policy Institute of California looks at the future of California housing and provides recommendations to expand affordable housing and address homelessness.
Posted by kidsdata.org
Post Comment
Mental Health Issues Account for Largest Percentage of Hospitalizations Among Youth
Hospitalizations by Primary Diagnosis: 2017
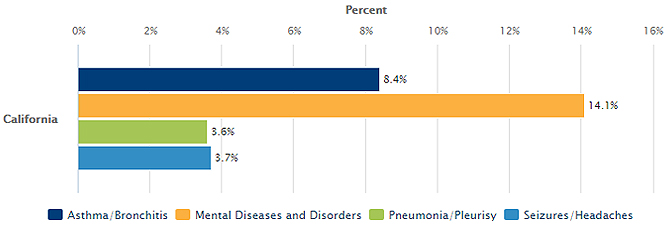
The highest percentage of hospitalizations among youth ages 0-17 in California was for mental health reasons in 2017. Mental diseases and disorders accounted for 14% of hospitalizations, as measured by discharges. This is almost twice the rate due to asthma/bronchitis (8%) and over three times the rate for pneumonia/pleurisy (4%) and seizures/headaches (4%). The rate of hospitalization due to mental health issues has been on the rise since 2008. Prior to then, the largest percentage of hospitalizations were asthma-related.
Expanding prevention, diagnosis, and early intervention services can help reduce mental health-related hospitalizations. Care coordination and discharge planning are also critical in addressing hospital admissions and re-admissions. This includes a standardized, child and family-specific framework for the transition from hospital to home care and a shared care plan created with the family and care team that takes into account the family’s circumstances and capabilities and timely follow up with the family after discharge.
Additional Resources
Throughout the month of May we are highlighting indicators related to children’s emotional health on our Twitter. Follow us @kidsdata and help bring awareness to this critical public health issue.
Teens are invited to share their ideas how to reduce the stigma and social barriers teens face when seeking mental health treatment. The National Institute on Minority Health and Health Disparities is hosting an essay contest to gather ideas from 16 to 18 year old teens. Deadline is May 31st.
Recently Released Data
We recently released data about infant mortality. See links to the latest here.
Posted by kidsdata.org
Post Comment
Licensed Child Care Not Accessible to Many
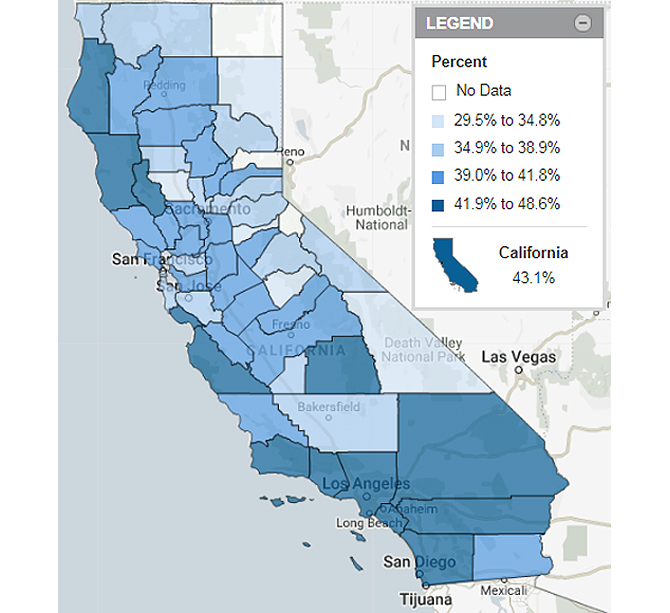
Percentage of Children with Working Parents for Whom Licensed Child Care Slots Are Unavailable: 2017
The amount of licensed child care in California is inadequate to meet the needs of working families. Over three-quarters of children ages 0-12 did not have licensed child care slots available to them in 2017. Child care access varied across counties and were highest in Kings County where slots were unavailable for 89% of children. In nearly all counties, rates have remained the same or worsened since 2010.
Center-based infant care is especially problematic in California which was ranked the least affordable state for infant care in 2017. That cost in 2016 was $16,452 a year which was more than fair market rent for a two-bedroom unit in the majority of counties in that year. In 24 counties, residents paid over $1,000 more per year for center-based infant child care than for a two-bedroom unit.
The challenge to find and pay for child care is a major source of stress for many families raising children in California. Policies such as extending family leave after birth can make a difference. Extended family leave would delay entry into child care thus reducing pressure on the child care system and decreasing cost to families while offering a stronger start for infants.
Child care data are available on kidsdata.org through our partnership with the California Child Care Resource and Referral Network. The Network promotes affordable, quality child care through research, education, and advocacy.
Data in Action
The California Campaign to Counter Childhood Adversity (4CA) advocates for policies that address childhood adversity and promote protective factors. On May 1, participants in the 4CA Policymaker Education Day, including Kidsdata, will visit legislative offices in Sacramento to share how childhood adversity impacts communities. Customized legislative district profiles about childhood adversity are now available for download.
Recently Released Data
We recently released data about hospitalizations, housing affordability, and unemployment. See links to the latest here.
Posted by kidsdata.org
Post Comment
Measures of Inequality
Percentage of Household Income Distribution, by Quintile: 2017
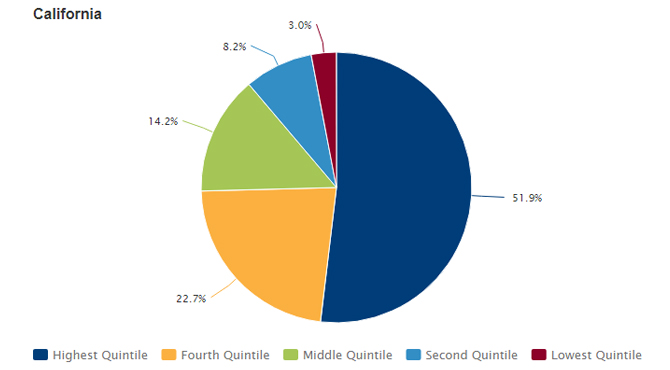
Income is not distributed evenly across California households. Across the state, some families can comfortably provide for their children’s needs and wants while other families struggle to provide basic clothing, food, and shelter. Some level of income inequality is expected, but when a portion of families cannot support their children’s basic needs, then it is a sign that income inequality has become too wide and poverty has become too deep.
Kidsdata has added new measures of income inequality: Household Income Distribution, by Quintile and the Gini Index of Household Income Inequality, with data available by city, county, school district, and legislative district. The indicator, Household Income Distribution, ranks households by their level of income, divides them into five equally sized groups, then determines the share of aggregate income that each quintile receives, where 20% for each group would represent income equality. The Gini Index expresses income inequality on a scale of 0 and 1, where 0 represents income equality.
How much of the pie do the highest earners get in California? Those in the highest quintile earned an estimated 52% of all household income in 2017, compared with a 3% share of total income earned by households in the lowest quintile.
Two counties (Marin and San Francisco Counties) with the highest level of income inequality in California, as measured by the Gini index, also have some of the highest family median annual incomes in the state, among counties with data in 2017.
While some income inequality is inherent in the economic structure of our society, extreme disparity reflects social and political choices. Let us prioritize children by shaping policies and practices that ensure their basic needs are met so that they may reach their maximum health potential.
Additional Resources
Learn about Stockton’s approach to addressing income inequality with the country’s first-ever city-led Guaranteed Income initiative.
The New Importance of Children in America argues that our standard of living and future economy demand that children become our highest priority.
Recently Released Data
In addition to measures of income inequality, we have recently updated data on Early Care and Education. See links to the latest here.
Posted by kidsdata.org
Post Comment
Measures of Poverty
Children in Poverty, Federal Poverty Threshold, Ages 0-17: 2008-2017
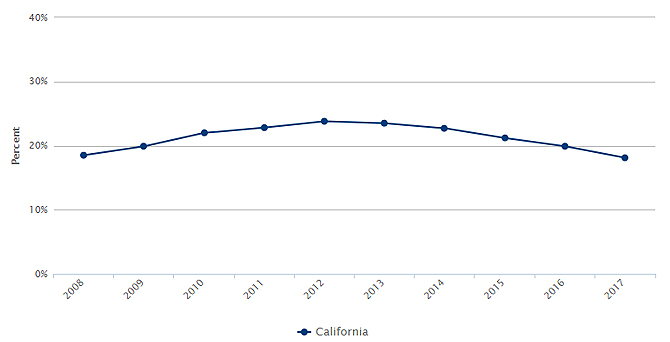
Too many families lack the means to meet their children’s basic needs. Poverty directly impacts access to housing, food, child care, education, and health services, and indirectly affects the ability of parents to meet their children’s social and emotional needs – all crucial to children’s health, development, well-being and future success.
Kidsdata has released updated data on three ways to measure poverty: the federal poverty threshold, the Supplemental Poverty Measure (SPM), and the California Poverty Measure (CPM). These three measures have different historical origins and incorporate different components of poverty. As with all of the topics we address, details about how an indicator is measured are provided in the “Measures of” section under tables and figures.
Kidsdata and the Population Reference Bureau recently reviewed data about poverty starting at birth. Learn more.
How are California children faring? Based on the federal poverty threshold, 18% of California children who were ages 0 to 17 were below the family poverty threshold of $24,858 in 2017, similar to the rate a decade ago. This measure compares pre-tax cash income against a threshold of three times the cost of a minimally adequate diet in 1963, adjusted for inflation. It is best used for measuring poverty over time, and it forms the basis for some administrative determinations.
Children in Poverty, Supplemental Poverty Measure (SPM), Ages 0-17: 2016
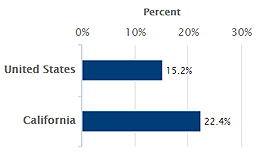
Based on the SPM, 22% of California children who were ages 0-17 were in poverty in 2016. This measure builds on the official poverty measure by accounting for expenditures and resources such as utilities and state-level differences in housing costs and government benefits and tax credits. It is useful for national and state comparisons.
Children in Poverty, California Poverty Measure (CPM), by Age Group: 2014-2016
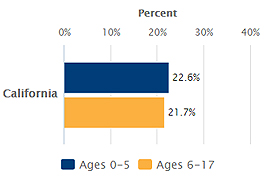
Based on the CPM, 23% of California children who were ages 0-5 were in poverty in 2014-2016. The CPM refines poverty measurement by accounting for expenditures and resources that are California-specific such as regional differences in housing cost. It is best used for in-state assessments and comparisons.
Policy and programmatic planning can influence poverty, even in areas where it may not seem relevant. For example, transportation planners might consider how public transit routes can efficiently connect their higher poverty and more rural constituents to health facilities. Addressing child poverty is essential to assuring a vibrant social and economic environment.
Additional Resources
California’s Future, a publication from the Public Policy Institute of California, provides an objective assessment of the housing crisis, health care, education system and more.
April 1, 2019 signals that there is one year until National Census Day, the reference day used for the 2020 U.S. Census. The Census Counts Campaign offers suggestions on ways to raise awareness of the critical importance of participating in the Census.
Recently Released Data
We recently released data on Family Income and Poverty. This release brings you 47 indicators including new breakdowns by legislative district. The topic includes data on poverty, deep poverty and concentrated poverty. Also in this topic, we include previously released data on poverty among mothers who recently gave birth. See links to the latest here.
Posted by kidsdata.org
Post Comment
Poverty from Birth
Poverty can alter children’s developmental trajectories in cognitive, socio-emotional, and physical health. The effects of poverty on child health and well-being can begin during pregnancy, as low-income women are more likely to experience risk factors such as malnutrition and stress, and are less likely to receive prenatal care. Children who face economic hardship when they are young, or who experience deep and prolonged poverty, are at greatest risk for poor outcomes.
A 2-page overview of this topic is available here.
Kidsdata and the Population Reference Bureau also reviewed data about poverty starting at birth. The analyses included poverty among infants ages 0-2 since 2012, among children ages 0-5 since 1969, and among children ages 0-17 since 1959. See links to the data sets below. For more information about poverty among children in California, visit the Family Income and Poverty topic.
Data Files:
- Poverty Status of People in the United States, by Age, Race, and Hispanic Origin: 1959 to 2017
- Poverty Status of Related Children in the United States, Ages 0-5: 1969 to 2017
- Poverty Status for California Children, Ages 0-2: 2012 through 2017
- Poverty Status of Families in California, Ages 0-17: 2017
Posted by kidsdata.org
Post Comment
Childhood Cancer Rates Higher for Older Youth
Childhood Cancer Diagnoses, by Age Group: 2011-2015
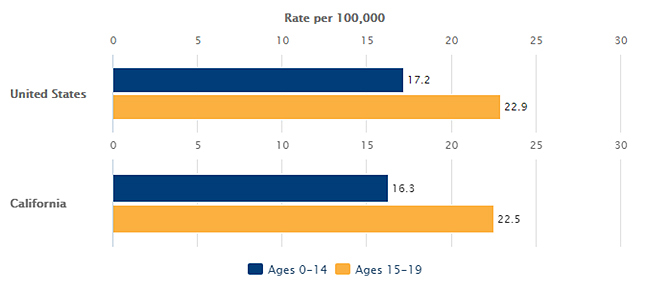
Childhood cancer rates of diagnosis are higher among older youth. Similar to rates in the United States, 23 per 100,000 teens ages 15-19 were diagnosed with cancer in California from 2011 to 2015 compared with 16 per 100,000 children under age 15. Difference in cancer rates by age is consistent across race/ethnicity groups. Moreover, older and younger youth are diagnosed with different types of cancer.
Pediatric cancer care is highly specialized depending on the type of cancer. The patient’s age also plays a role in determining the best medical approach to provide each child with the highest chance of survival and full recovery. Palliative care, which provides supportive services for sustaining quality of life during and after treatments, also should be age-specific. Many of us can play a role in improving the quality of life for pediatric patients and their families as they face complex physical, emotional, and logistical challenges throughout diagnoses, hospital stays, and beyond.
Policies and programs are key to maximizing positive health outcome and quality of life for pediatric cancer patients.
Additional Resources
Treating Cancers in Adolescents, from the American Cancer Society, describes the uniqueness of treating cancer among older youth.
The Innovation Pop-Up Space at Stanford’s Adolescent and Young Adult Cancer Program gives patients a place to create their own inventions while receiving treatment.
Spotlight on Hope Film Camp recognizes that cancer is fought on many fronts. Through creativity and film production, this camp offers a respite to youth who are fighting cancer.
Posted by kidsdata.org
Post Comment