

One in Five California Children Do Not Have Consistent Access to Food
Children Living in Food Insecure Households: 2011-2017
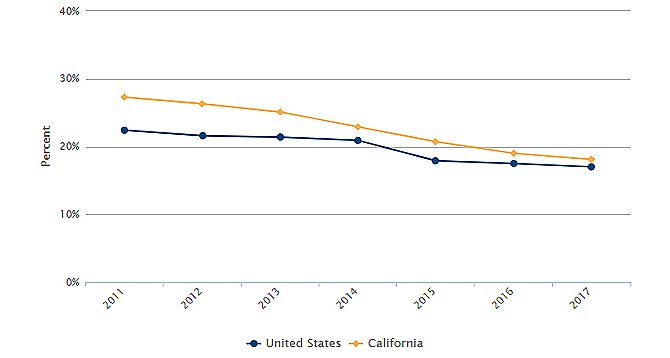 Food insecurity – a lack of consistent, dependable access to enough food for healthy living – is a major public health problem in California and across the country. Although the percentage of food-insecure children has been on the decline since 2011, California rates consistently exceed those for the U.S. overall. Almost one in five California children live in households with limited or uncertain access to adequate food. Children that are food-insecure are more likely to experience health problems, including developmental, cognitive, behavioral, and mental health issues.
Data related to food assistance programs show that some race/ethnicity groups are disproportionately affected by food insecurity. The CalFresh (Food Stamps) supplemental nutrition program served almost 4 million children and adults in 1.9 million households in July 2018. From 2008 through 2018, non-white households accounted for almost three-quarters of participants statewide.
Inconsistent access to food is deeply rooted in poverty. Strengthening safety net programs so that low-income children, expectant mothers, and families receive adequate nutrition helps ensure the health and well-being of all Californians.
Additional Resources
Public school meals are a critical part of the school day, supporting children’s academic achievement and health. Visit the Food Research & Action Center website to learn how federal programs like the School Breakfast Program, National School Lunch Program, and Community Eligibility Program help address food security.
New Initiative to Address Toxic Stress from Childhood Trauma
The California Surgeon General and Department of Health Care Services (DHCS) launched the ACEs Aware initiative, a first-of-its-kind statewide effort for health care providers to screen patients for Adverse Childhood Experiences (ACEs). Through this initiative, Medi-Cal providers can receive training, clinical protocols, additional resources, and payment for screening children and adults for ACEs. There is also a two-hour online curriculum for a wide range of health care professionals that provides continuing medical education (CME) and maintenance of certification (MOC) credits.
Recently Released Data
We recently released data about Food Security and Nutrition. See links to the latest here.
Posted by kidsdata.org
Post Comment
Reconnect to Disconnect from Cyberbullying
California Students Who Were Cyberbullied Four or More Times in the Previous Year by Levels of School Connectedness: 2015-2017
Grades 7, 9, 11 and Non-Traditional Programs
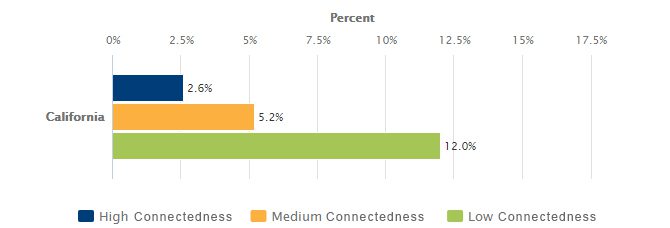
One in five California 7th, 9th, and 11th graders were cyberbullied in the previous year, from 2015-2017. Students with low levels of school connectedness were more likely to be victimized online than their more connected peers. There were 12% of California students with low levels of school connectedness who were cyberbullied four or more times, compared to about 3% of those with high levels of school connectedness in grades 7, 9, 11, and non-traditional programs. Ensuring students feel safe and connected to their schools can diminish the prevalence of cyberbullying.
Cyberbullying is not as easily detectable as in-person bullying and is a growing concern among teachers and families as more children and youth communicate online and via social media. Cyberbullying can often be an extension of in-person bullying at school, worsening the social and emotional stress on children. According to a study from the U.S. Department of Justice, experiencing a mix of online and in-person harassment had the highest negative emotional impact on children compared to in-person only and online-only incidents.
See more data on how the prevalence of cyberbullying varies by gender, race/ethnicity, and sexual orientation.
Additional Resources
California has enacted laws to address cyberbullying, and state and federal policies provide guidance on effective school discipline strategies. These policies encourage schools to teach students social and behavioral skills and to create positive, supportive school environments to promote school connectedness. StopBullying.gov is a federally funded online resource with a wealth of information on cyberbullying and harassment policies, prevention strategies, and helpful tips on how to address cyberbullying incidents.
Recently Released Data
We recently released data about Pupil Support Services and Bullying and Harassment at School. See links to the latest here.
Posted by kidsdata.org
Post Comment
Timely Dental Care Remains a Challenge for Some California Children
Children Ages 2-11 Who Received Dental Care Less Than Six Months Ago: 2015-2016
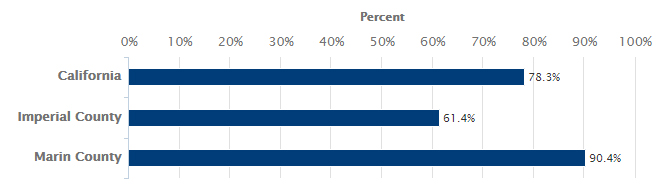
Oral health is essential for healthy development and affects overall health. However, not all California children are receiving dental care at recommended intervals. Overall, 78% of children ages 2-11 received dental care within six months in 2015-2016. Timely dental care varied greatly across California, ranging from 61% in Imperial County to 90% in Marin County.
California ranks among the worst in the nation on measures of children’s oral health and access to dental care, with the highest rates of dental disease and greatest barriers to care consistently experienced by the most vulnerable children. By receiving routine dental care every six months and addressing dental problems early, children avoid potentially damaging effects of poor dental health such as physical pain, speech issues, sleep deprivation, school absences, and problems with self-confidence.
Additional Resources
The California Department of Public Health in collaboration with the Department of Health Care Services, developed the California Oral Health Plan 2018–2028. The plan provides a roadmap for improvements in oral health and identifies five key goals for achieving oral health equity for all Californians.
Recently Released Data
We recently released data about Foster Care. See links to the latest here.
Posted by kidsdata.org
Post Comment
Promising Findings in Infant Health
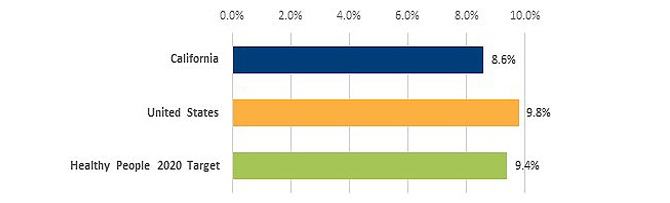
Percentage of Infants Born Preterm Based on Obstetric Estimates (OE) of Gestation: 2016
Recently updated topics on infant health in California show positive findings in establishing a strong start for babies, but inequities persist. A few findings include:
Low Birthweight and Preterm Births: Based on obstetric estimates, 8.6% of infants were born preterm (before 37 weeks of gestation) in 2016, exceeding the U.S. average of 9.8% and the Healthy People 2020 target of 9.4%. Obstetric estimates of preterm births is a new indicator on Kidsdata.org.
Teen Births: The teen birth rate has declined from 63 per 1,000 births to 16 per 1,000 births between 1995 to 2016. Reducing teen births decreases instances of infants born with low birthweight and preterm births.
Prenatal Care: Mothers receiving prenatal care in the first trimester in 2016 varied by race/ethnicity, with 88% of infants of white mothers as compared to 70% of infants of American Indian/Alaskan Native mothers receiving prenatal care.
Breastfeeding: Exclusive breastfeeding of newborns while in the hospital in 2018 also varied by race/ethnicity, with 81% of white mothers as compared to 62% of African American/Black mothers exclusively breastfeeding.
Additional Resources
October is Sudden Infant Death Syndrome (SIDS) Awareness Month. Find toolkits and resources offered by the California Department of Public Health SIDS Program.
Recently Released Data
We recently released data about Low Birthweight and Preterm Births, Teen Births, and Breastfeeding. See links to the latest here.
Posted by kidsdata.org
Post Comment
Perceptions of Safety by School District
Ninth Grade Students’ Perception of School Safety in California and in Princeton Joint Unified School District: 2015-2017
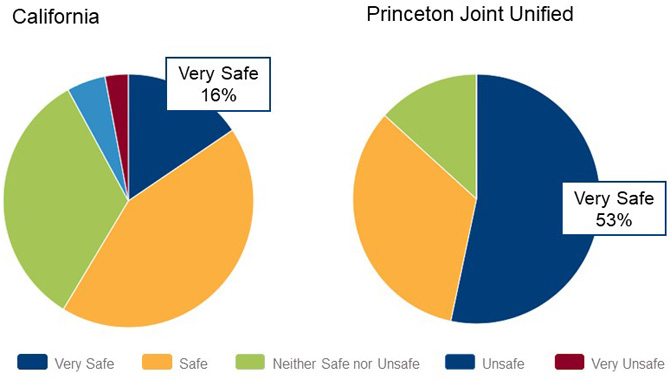
All California students deserve to feel comfortable and secure at school. Perceptions of school safety are essential for learning, building friendships, and supporting emotional and physical health. However, the California average differs substantially from the best performing school district in school safety, among districts with data. The statewide average of 9th grade students who felt very safe at school during the 2015-2016 and 2016-2017 school years was 16%, far below the average in Princeton Joint Unified School District (Glenn County) where 53% of 9th grade students felt very safe. This gap between the California average and the best performing district suggests that we can do more to create nurturing school environments for all students.
Data on student behaviors, such as fighting or carrying a weapon, help further inform disparities in school safety. During the 2015-2016 and 2016-2017 school years, 11% of 9th graders were in physical fights, 2% carried a gun, and 6% carried a weapon other than a gun at school, though percentages varied by school district. By looking at student perceptions of school safety and behaviors that play a role in being safe, we can make informed decisions on policies and programs that support each child’s well-being.
Quick Tip: Find Data by School District
Elevate local issues such as school safety with school district-level data. Find your school district’s safety data on the Data by Region tab. Click into your county, select your school district, then choose the “Child and Youth Safety” radial button to customize a table into a compelling figure that expresses your concern in children’s well-being.
Recently Released Data
We recently released data about School Safety. See links to the latest here.
Upcoming Webinar
Integrating ACEs Science in Pediatrics: Early Adopters Share Lessons from the Field
Thursday, October 17 at 8 am PST, hosted by 4CA and ACEs Connection
In 2017, California became the first state in the country to pass a law supporting universal screening for adverse childhood experiences (ACEs) in the 5.3 million children in the state’s Medicaid program. Drs. Deirdre Bernard-Pearl, R.J. Gillespie and Ariane Marie-Mitchel will discuss how to transform an entire clinic or medical residency program for screening families for ACEs and offering them support. Learn more and Register.
Posted by kidsdata.org
Post Comment
Academic Motivation of California Students
High Levels of Academic Motivation (Student Reported), by Grade Level: 2015-2017
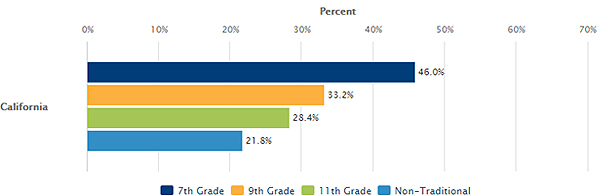
Academic motivation is directly tied to educational outcomes and associated with positive behaviors in children. Schools with higher populations of academically motivated students reinforce individual academic success and contribute to a supportive school environment. Interestingly, student and teacher reports of students’ levels of academic motivation vary greatly. In California, about one-half of 7th graders, one-third of 9th graders, one-fourth of 11th graders, and one-fifth of students in non-traditional schools reported high levels of academic motivation during the 2015-2016 and 2016-2017 school years. In contrast, fewer than one in ten school staff members reported that nearly all students were motivated to learn at each of the middle school, high school, and non-traditional school levels.
Across the grade levels surveyed, greater percentages of girls reported high levels of academic motivation compared with boys. Also, greater percentages of students who were Asian or white reported high levels of academic motivation compared with students who were African American/black or multiracial. Comparisons are also available by parent education level, sexual orientation, and level of school connectedness and for counties and school districts.
Academic motivation is associated with a positive school climate. When students feel safe and connected to school, interact with caring staff, and participate meaningfully, they generally perform well academically and engage in healthy behaviors. By addressing factors related to school climate, like academic motivation, we strengthen the school community and support each child’s well-being.
Additional Resources
Engaging all school stakeholders – leaders, staff, students, families, and community members – is important to develop and maintain a shared understanding of a positive school climate and how it can be achieved. The Safe and Supportive Schools website, developed by WestEd for the California Department of Education, offers tools to support data-driven school climate improvement.
Recently Released Data
We recently released data about School Safety and School Climate. See links to the latest here.
Posted by kidsdata.org
Post Comment
The Policy Impact on Immunizations
Number of California Kindergartners with Permanent Medical and Personal Belief Exemptions: 2011-2019
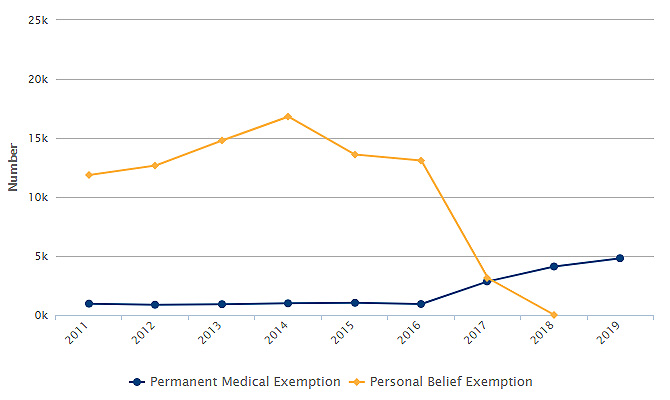
Two notable immunization trends emerged with the passage of California’s vaccine law which took effect in July 2016. Under SB 277 parents can no longer cite personal beliefs as a reason to not vaccinate their children. Since then, immunization rates increased overall and reached a key threshold statewide. Additionally, the number of exemptions from immunizations for personal beliefs dropped while the number of exemptions for medical reasons increased.
Trend 1: The state has achieved herd immunity for the most contagious diseases, including measles. In 2019, 95% of California kindergartners were immunized against vaccine-preventable diseases. However, 27 counties have not reached the 95% threshold, among counties with data.
Trend 2: The number of exemptions for personal beliefs dropped precipitously from a high in 2014 of 16,817, in accordance with the law. In contrast, exemptions for permanent medical reasons increased from 991 in 2014 to 4,812 in 2019.
Protecting individual children and our community of children from vaccine-preventable diseases leads to healthier lives and reduced health care costs. The 2016 policy change directly and immediately impacted immunization rates statewide, but local communities also require the same high level of immunization rates to maximize protection. Continued policy efforts can bring the same level of protection to all children.
In the Legislature
On Monday, the governor signed Senate Bill 276, changing how medical exemptions are processed. It establishes an electronic, standardized, statewide medical exemption system by January 2021 and requires physicians to use this system when granting a medical exemption. Staff at the State Department of Public Health will review exemptions in the system to identify physicians with five or more submissions and schools with immunization rates under 95%.
Data in Action
Data can be more than just numbers. Along with Kidsdata News, we also share information on critical topics, from recent news to data findings on our Twitter. Follow us @Kidsdata. We’re here to answer any questions or partner to highlight key children’s health issues. Reach out to us: [email protected].
Recently Released Data
We recently released data about Immunizations and Prenatal Care. See links to the latest here.
Posted by kidsdata.org
Post Comment
Unintentional Injuries Are Leading Cause of Death for Children
Child/Youth Death Rate, by Age and Cause: 2014-2016
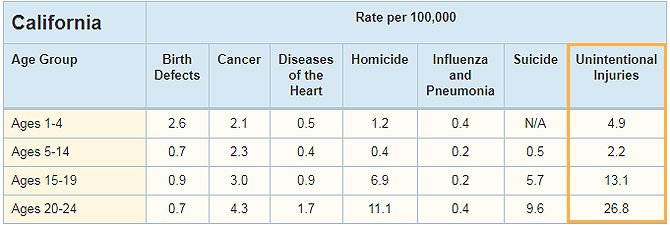
Unintentional injuries were a leading cause of death for ages 1-24 overall in California from 2014-2016. The death of any young person is a tragedy, but deaths from unintentional injuries, or preventable injuries, such as motor vehicle accidents, drowning, and falls are particularly troubling. For children ages 1-4, the most common cause of unintentional injury-related death is drowning; for 5- to 24-year-olds, the most common cause is motor vehicle accidents. Since at least 1996, unintentional injuries have been the leading cause of death for youth ages 15-19.
The data reveal that preventable deaths do not discriminate. Unintentional injuries is the leading cause of death across all racial/ethnic groups, with the exception of African American youth, for whom homicide was the leading cause of death.
Protecting children and youth from unintentional injuries requires both a local and system-level approach, from addressing risk factors, to promoting awareness. Changes in public policies can help reduce risk factors associated with unintentional injuries such as implementing a graduated driver license program to age 21 (Assembly Bill 1267). We must spread awareness on how best to protect our children, especially when their leading cause of death is preventable.
Additional Resources
The California Coalition for Children’s Safety and Health offers safety tips and best practices on drowning prevention, bicycle safety, and more.
According to a recent Kidsdata survey, our most popular topic areas are: physical health; child care and education; and mental, emotional, or behavioral health. Whatever your interest, you can be the first to know about new and recently released data by signing up for customized data alerts. Select the topics, geographies, or demographic groups that interest you, and you will receive an email alert when data are released.
Posted by kidsdata.org
Post Comment
Using Data for Action: Resources and Success Stories
Data have the power to transform the way we see the world, helping us identify health disparities and drive policy change. The Data in Action section of kidsdata.org provides tips and tools for creating data-driven change, as well as success stories of how the Kidsdata community is using data to support children’s health and well-being.
Resources
Learn how to leverage data to create meaningful change. Three helpful tools:
- Crafting a Message for Data-Driven Change: Communicate about children’s health issues with a compelling purpose and message
- Five Criteria for Good Data: Use these criteria to determine the best data to support your work
- Telling Your Best Data Story: Learn how to select the best visualization for your report, presentation, proposal or advocacy efforts
Success Stories
Data can be used to advocate for polices and legislation, assess community needs, strengthen grant proposals, and much more. Read examples of how the Kidsdata community is using data for action, from analyzing bills in the California Legislature to supporting county-wide initiatives and demonstrating the need for children’s health programs in local communities.
How are you using data for action? Share your story.
Recently Released Data
We recently released data about Death and Dental Care. See links to the latest here.
Posted by kidsdata.org
Post Comment
Sexually Transmitted Infection Rates Vary Widely by Race/Ethnicity
Sexually Transmitted Infections by Race/Ethnicity, 2015
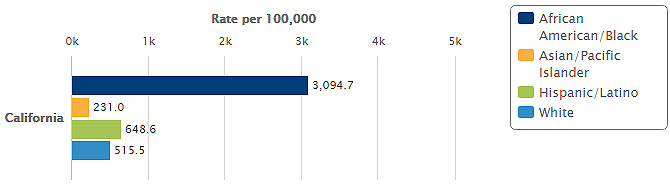
Recent data show disparities in teen sexual health by race/ethnicity in California. Just over 34,000 youth aged 10 to 19 were diagnosed with Chlamydia in 2015. African-American youth were six times more likely to contract Chlamydia compared to White youth and 13 times more likely than Asian/Pacific Islander youth of the same age.
Being informed about sexual health is vital to teen’s overall well-being. Some sexually transmitted infections (STIs) rarely show any symptoms, which if untreated may lead to infertility and other adverse health outcomes. When youth are informed about sexual health, they may be encouraged to practice safer sex or choose abstinence, lowering their risk of contracting STIs. Furthermore, creating conversations about consent has an important role, as does public health policies that encourage using confidentiality laws to protect teens. Efforts to improve teen sexual health in California should also include more opportunities for STI screenings among teens.
Additional Resources
Love Matters is an online space for young adults around the world to openly talk and ask questions about reproductive health, safer sex and relationships.
Recently Released Data
We recently released data about Teen Sexual Health. See links to the latest here.
Posted by kidsdata.org
Post Comment