Palo Alto City Council’s Top Priorities Include Kids
Our office is located in Palo Alto, CA, just down the street from city hall, so it’s gratifying to see that the Palo Alto City Council voted a few weeks ago to make a focus on youth well being one of the cities top 5 priorities for 2010. Adolescents in Palo Alto have gone through a tough period, with a recent spate of teenage suicides. But kids in communities across California face steep challenges, so it’s important that local governments make them a priority. Do you know of any others that have?
For those interested in more about Palo Alto’s kids, here’s a data summary.
Posted by Andy Krackov
Tags: Child Health Initiatives
How Do You Want to Hear From Us?
Here at kidsdata.org, we want to deliver news and data about kids in a way that’s convenient for you. Please take a moment to answer 3 quick questions, to tell us what you’d like to receive, and how you want to hear from us.
Posted by kidsdata.org
Post Comment
Bill to Tax Sodas Would Fund Childhood Obesity Programs
 Last week, CA’s Senate Majority Leader Dean Florez introduced legislation to tax sodas and other sugar-sweetened beverages to fund childhood obesity programs in cities and school districts across the state. Given that this legislation may lead to more discussion in Sacramento about kids’ weight, we thought we’d note some related facts:
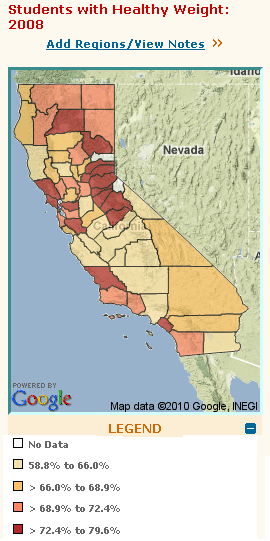
- The percent of 7th graders at a healthy weight has barely budged over the last decade. In 1999, 67% of CA’s 7th-graders were at a healthy weight; in 2008, that percentage inched upward just slightly, to 68%. Percentages and trends were similar for other grade levels.
- The percentage of kids at a healthy weight varied greatly by county, with several Eastern California counties (Nevada, Plumas, Calaveras, Placer, and Mariposa) having the highest percentages of 7th-graders at a healthy weight in 2008.
- And there also were some vast racial/ethnic disparities. About 80% of Asian-American 7th-graders in California were at a healthy weight, compared to 56% of Pacific-Islanders and 61% of Hispanic/Latinos.
School district-level data are available, too, by clicking on any of the links noted above. And if you know of effective programs or awareness campaigns in your community to help ensure that more kids are at a healthy weight, please add your comments below.
Posted by Andy Krackov
Tags: Child Health Initiatives
ITUP Conference Re-Cap: A Focus on Special Needs
 On Feb. 10, I attended the Insure the Uninsured Project conference for the first time, and was extremely encouraged to see such a large and diverse group of key governmental players coming together to talk about health care.
Although I was attending the conference as an exhibitor, I had the opportunity to attend a session focused on insuring kids, which featured a panel of knowledgeable and distinguished speakers, led by Wendy Lazarus of the Children’s Partnership, a veteran in the realm of children’s issues:
- Toby Douglas, from the state Department of Health Care Services
- Dr. Richard Pan, a pediatrician at UC Davis and now candidate for state assembly
- Suzanne Shupe, executive director of the California Children’s Health Initiatives.
Interestingly, the session on insuring kids didn’t focus as much as I expected on the federal health care debate and its impact on kids, especially with reference to the Children’s Health Insurance Program (CHIP), but instead the speakers focused on California’s kids — and, in particular, children with special health care needs. The panel was quick to point out the importance of considering this population when discussing health care for kids. In particular, panelists said, kids with special needs face a system that needs reform.
If you serve kids in your work, or have an interest in making sure all kids in California are insured, I encourage you to listen to this panel’s discussion online at ITUP’s website. (Materials and audio will be posted soon at http://www.itup.org/this-years-conference.html.) I didn’t get a chance to attend any other sessions. But, if you also attended the conference and you’d like to leave a re-cap here, feel free!
Posted by Felicity Simmons
Tags: Child Health Initiatives, CSHCN
Do CA Kids Eat Breakfast?
Just launched on kidsdata.org: Indicators measuring student reports of whether they ate breakfast that day, available both by grade level (7th, 9th, and 11th) and gender, and by race/ethnicity. These data come from the California Department of Education’s California Healthy Kids Survey (CHKS), which is administered by WestEd.
So do California students eat breakfast? Here are some state-level highlights:
- The majority of 7th, 9th, and 11th graders say they eat breakfast.
- In 2006-2008, California 7th-grade students were more likely than 9th and 11th graders to say they ate breakfast that morning.
- Among 7th and 9th graders, boys were more likely than girls to say that they ate breakfast that morning.
- Asian American and Caucasian/White students were most likely to say they ate breakfast.
Posted by Sarah Marxer
Tags: New Data, Statewide Expansion
The Status of Kids’ Dental Care in California
 Any guesses as to how many kids have cavities in CA? It may be hard to say with certainty, but some experts in the state think as many as one-half of kindergartners have cavities – and this issue, plus numerous other dental-related problems, causes a significant number of kids to miss school. These problems are highlighted in Viji Sundaram’s article, Kids’ Dental Decay Takes a Bite out of School Attendance, from New America Media. The article is the result of a partnership with our foundation.
Since it’s National Children’s Dental Health Month, we thought we would note some related data from kidsdata.org. Unfortunately, California lacks a broad array of locally available, statewide measures of kids’ dental health, but what we have from the California Health Interview Survey still helps illuminate how California is faring. For example:
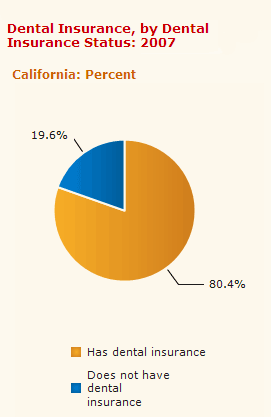
- About one in five kids in CA lack dental insurance, according to 2007 data, and county-level percentages vary greatly across the state.
- Here in California, it’s not unusual for kids to have never seen a dentist. These same 2007 data show that 13% of California’s kids – 1 in 8 – have never been to the dentist.
Fortunately, there are numerous statewide organizations focusing attention and resources onto dental care for California’s kids, including the Dental Health Foundation and the California Dental Association. And on the local level, there are some excellent models – such as San Mateo County’s participation in the national Give Kids a Smile Day, which offers free dental care for the kinds of kids noted in the data above – those who lack insurance or otherwise have limited access to a dentist.
Posted by Andy Krackov
Tags: Health Observances
Welcome to Data Points!
Our goal for this new kidsdata.org blog is to foster helpful conversations among people who use data to improve the health and well being of children. We hope that kidsdata.org, which now offers data on children for all counties, cities and school districts in California, will be a valuable tool for you. Please check in regularly to post your comments and to keep up to date on new data and enhancements.
On the blog, you’ll find:
- Information about data efforts taking place throughout the state
- Examples of how others use data in their work
- Data analysis and information from kidsdata.org’s expert staff
- A forum to ask questions about data
- Updates on issues affecting the health of California’s kids, and more!
You can help build a community of data users by posting items on our Kidsdata In Action page about how you are using kidsdata to improve the health of children. That page also features items about how others are utilizing the site’s many offerings. Also, if you blog about children’s health or data, link to us from your blogroll, and let us know what you’re blogging about.
Our foundation launched kidsdata to further our vision that all children in the communities we serve are able to reach their maximum health potential. We believe that decisions based on data are most likely to bring that vision to reality.
David Alexander, MD
President and CEO, Lucile Packard Foundation for Children’s Health
Posted by David Alexander, MD
Tags: News About Kidsdata.org
Help Make the 2010 Census Fair and Accurate
 The 2010 Census is fast approaching. As data users, we all know how important it is to have accurate data about the populations in our communities. Historically, low-income communities, communities of color, and immigrants have been less likely to respond to the Census. Undercounting people in these communities leads
to less fair decisions about political representation and the distribution of
federal, state, and county funds – including funding for education, health,
and social services.
Of concern to all of us across California: Ten of the 50 “hardest to count” counties in the nation are right here in California, though all counties contain pockets of people at risk of being undercounted.
What can you do? Organizations working in these communities will be critical to ensuring a fair and accurate count. The Nonprofits Count website is a hub for nonprofits interested in engaging in Census-related activities; this resource provides a comprehensive tool kit and suggests ways to reach your community. Community-based organizations also can partner with the Census to spread the word in your community through posters, newsletter announcements, brochures, and other customizable materials. And you can use the Healthy City California website to find out where the “hard-to-count” communities in your area are located. Multi-lingual outreach materials and other information are available on the 2010 Census website.
Posted by Sarah Marxer
Tags: Data Challenges, Data Sources
Child Safety Data Added for All CA Counties
 The kidsdata.org expansion continued in January with the addition of data about child safety — child abuse, foster care, and domestic violence — for all counties in California. In all, more than 25 indicators were added, and the data show some interesting tidbits
of information:
Child Abuse
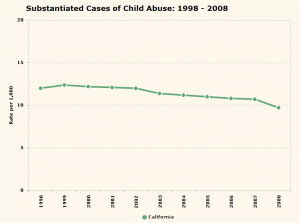
- California’s rate of substantiated cases of abuse is declining, as are the number of cases.
- Race/Ethnicity: Native American, African American/Black kids disproportionately affected.
- Type of Abuse: Neglect is the most common.
- One-page highlights on child abuse >>
Foster Care
- In ‘08, 68,127 children in CA were in foster care, a 37% decline since ’98.
- The rate of first entries is down statewide and in most CA counties since ’98.
- CA infants enter foster care at roughly three times the rate of any other age group.
- One-page highlights on foster care >>
Domestic Violence
- Rate: The statewide rate of calls for assistance dropped 29% from ’98 to ’08.
- In 2008, there were 166,343 domestic violence calls to law enforcement.
- One-page highlights on domestic violence >>
As you may know, statewide data on many other topics will be added over the next few months as kidsdata.org continues its statewide expansion. View a timeline of when data will be added>>
Looking for data that aren’t included on that timeline? Let us know.
Posted by Felicity Simmons
Tags: New Data, Statewide Expansion
Just Released: Children Now’s Annual Report Card
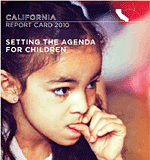
 Children Now recently released its annual report card, offering an issue-by-issue assessment on how California’s kids are faring. Most of the grades ranged from Cs to Ds. The highest grade was a B+ in the afterschool category. Children Now points out that the overall grade point average in 2010 was lower than at any other time in the 20-year history of the report card.
Posted by Andy Krackov
Tags: Child Health Initiatives, Data Projects


