Learn About LA’s Communities Using the LA Times New Neighborhood Map
Ever wanted to know more about your neighbors, but were afraid to ask?
Well, the LA Times has asked about your neighbors for you — and mapped out the answers with its neighborhood mapping project.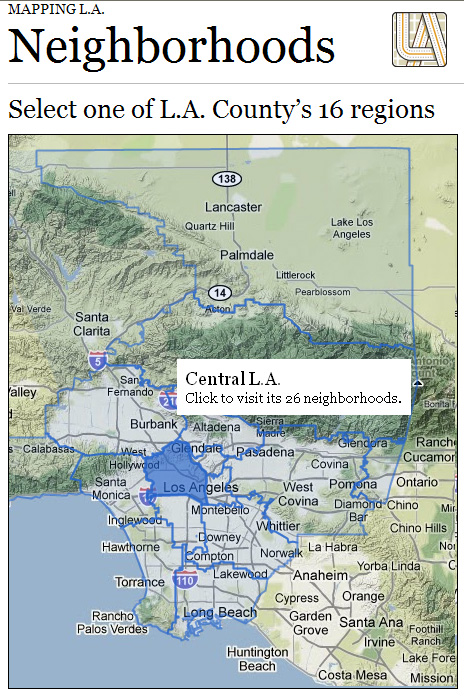
Through a joint effort, the Los Angeles Times and its readers have mapped L.A., providing individual maps and statistics for approximately 158 cities and 114 neighborhoods within the city.
The Times’ neighborhood maps offer information regarding income, education, schools, age, population, and ethnicity, along with up-to-date news from each selected area. You can click on a region to see the neighborhoods available, and then click on any one to view a more detailed map.
As an example, the maps show considerable differences among education levels. In the San Marino neighborhood of the San Gabriel Valley, 70 percent of residents age 25 and older have a four-year college degree, while in the nearby South El Monte neighborhood, that number is a drastically lower 3 percent.
This new mapping tool may well become a valuable resource for Los Angeles-area neighborhoods. Do you know of similar projects statewide where media organizations have mapped their community?
Posted by kidsdata.org
Tags: Data Projects
One in Three CA High School Graduates Ready for College
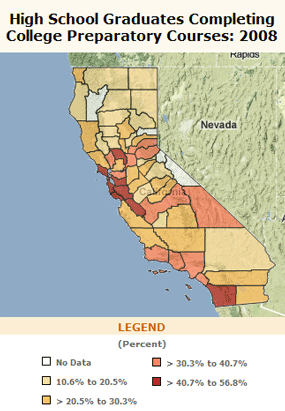
New college readiness data on kidsdata.org indicate that in 2008, about one in every three high school graduates was college ready – as measured by completion of college preparatory courses required for admission to the UC and CSU systems with a grade of “C” or better.
Looking specifically at counties and how they compare to the state average, the top five counties were all in the Bay Area.
Drilling down to specific parameters such as school districts and race/ethnicity, some wide disparities appear. At the school district level, college readiness ranges from two percent in some districts to more than 75 percent in others. Ethnically, 59 percent of Asian American students are ready for college, while African American and Hispanic students are both at 23 percent.
Are these numbers surprising to you? Without knowing the data, what percentage of high school graduates would you guess to be college ready?
Posted by kidsdata.org
Tags: New Data
Our Melting Pot: A California Perspective on the Generational Divide Over Immigration
 California, it turns out, is diverse even within its diversity, at least judging by newly available immigration data from the Census Bureau’s American Community Survey. In Shasta, Mendocino, Tuolumne, and many other counties, the percent of residents who are foreign born is a tiny fraction of the overall population, adults or kids. But in other counties – Los Angeles, San Francisco, San Mateo, and Santa Clara – nearly half (or more) of residents in some age groups are foreign born.
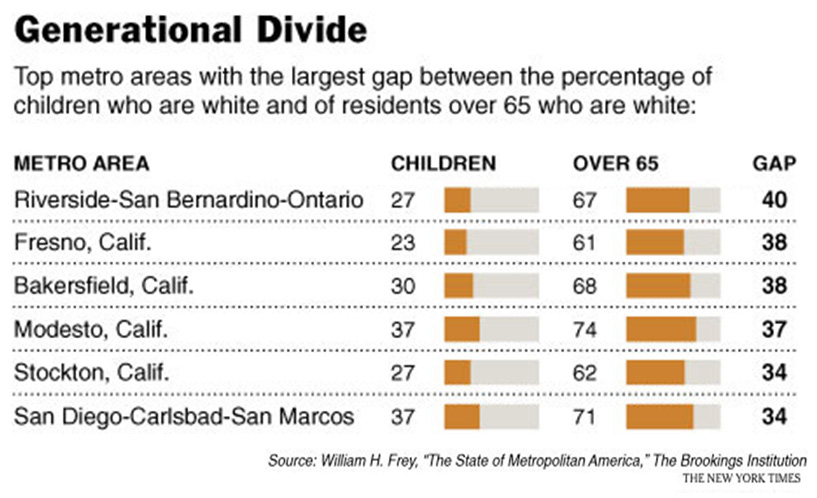
Another interesting demographic difference is the generational divide evident in a graphic from the New York Times. California is home to six of the 11 metropolitan areas nationwide that have the largest gap between the percentage of children who are white and of residents over 65 who are white: Riverside-Ontario-San Bernardino, Fresno, Bakersfield, Modesto, Stockton, and San Diego-Carlsbad-San Marcos.
These data are compelling, given survey results that show a generational difference on opinions regarding immigration. A recent New York Times article offers insights as to why younger and older generations differ about their feelings on immigration. The article notes that baby boomers and older Americans “came of age in one of the most homogeneous moments in the country’s history.” In 1970, for example, less than 5 percent of the country was foreign born. By contrast, 13 to 15 percent of the U.S. was foreign born from 1860 through 1920. That percentage – roughly three times the figure in 1970 – is actually quite similar to breakdowns today.
Posted by Andy Krackov
Tags: Data Projects
2008 CA High School Dropouts Could Fill Two Baseball Stadiums
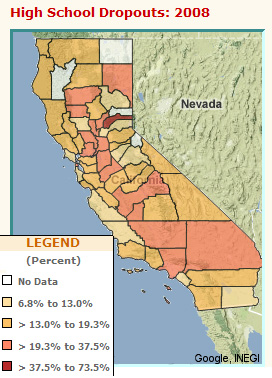 According to our recently released data on high school dropouts, in 2008 about one in five kids in California (19%) dropped out of high school during grades 9-12, a total of nearly 100,000. That’s down from 109,000 in 2007, but each year roughly 100,000 dropouts enter an already shaky California economy. To put those numbers into perspective, you could fill Anaheim’s Angel Stadium twice over with 2008 California dropouts, and still have nearly 10,000 more kids waiting outside.
Hispanics/Latinos, who represent 49% of California’s public school students, accounted for more than half of all dropouts (nearly 55,000). African American/Black students had the highest dropout percentage rate, with nearly one in three (32.9%) quitting school during grades 9-12. Asian Americans had the lowest rate, at 7.9 percent.
Educators nationwide share concern over dropouts, because they are more likely to use drugs and alcohol, get involved in criminal activity, and become teen parents.
What’s happening locally in your school district? Have you seen an increasing or decreasing trend in high school dropouts? What factors might be contributing to these trends in your community?
Posted by kidsdata.org
Tags: New Data, Statewide Expansion
Children’s Health — Read All About It
Recently, we polled kidsdata users — perhaps you participated — to ask how often you’d like to hear from us; and what information you’d like to receive. We learned that monthly newsletters are far too infrequent, according to our users, and those who took the survey also alerted us to their thirst for general news about children’s health issues.
Thus, the Kidsdata News Roundup was born. This occasional e-newsletter will note issues in the news, research findings about children’s health and well being, and related data from kidsdata.org. Take a look at our first issue, available here, and let us know what you think.
Don’t worry, we’ll still be sending out regular e-mail advisories to note new and updated data on kidsdata.org.
Want to receive the round-up, and all our e-mail notifications? Sign up here.
Posted by Felicity Simmons
Tags: News About Kidsdata.org
Millions of Facts – But Do We Have Yours?
 On kidsdata.org, we have millions of data points across hundreds of measures of child well being. So you’d think that we possess all the data that people in California ever could want. Yet whenever we’re in Los Angeles, we invariably get questions about data we don’t have. Preschool or afterschool enrollments, HIV among parents, media consumption among adolescents, art programs in schools, data for children 0-5 who have special health care needs, rates of 2nd teen births. The list literally goes on.
And at the opposite end of the state, in Redding, a similar craving for hard-to-find data emerged during some recent meetings. There in Shasta and neighboring counties, we heard about one of the more pressing issues affecting kids up there –drug abuse – and the resultant need for data on parental substance abuse and prenatal drug exposure, as well as fetal alcohol syndrome. People also expressed a desire for data on abuse of kids with special needs, child care waiting lists, maternal depression, and the numbers of children born to teen parents.
All of these, of course, are important issues affecting the physical and emotional health of kids. However, for some of these topics, we don’t know of sources that regularly collect quality data in a uniform way across California. Do you?
“We’ve got your numbers.” That’s what we say on the kidsdata home page. And in most cases when you visit kidsdata, you’ll find a measure that meets your needs. But when you don’t, we want to hear from you. Send us an e-mail through our feedback page. Better yet, broaden the conversation by asking us publicly through Twitter or Facebook, or by posting your query on this blog’s Data Questions page. More often than not, unfortunately, a quality data source simply may not exist for a desired issue. But even if it doesn’t, the more we communicate about the need for these data, the closer we’ll get to developing such sources. In some instances, of course, you may be able to point us to a source, in which case we can consider adding these data to kidsdata.
Let’s all start conversations about the data we need. We hope the links noted above can help serve as a catalyst for such discussions, which, in turn, can lead to the creation of a data agenda on children’s issues. Ten years from now, we just may have developed sources of data for at least some of the issues noted above. What a gift that would be to the nearly 10 million kids we collectively serve here in California.
Posted by kidsdata.org
Tags: Data Challenges
New Report Projects that Conditions for U.S. Kids Will Worsen
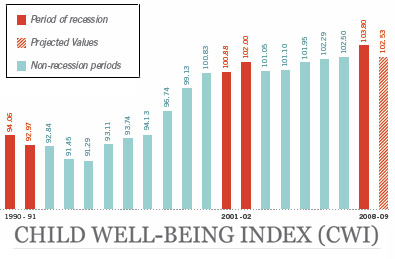 The 2010 Child Well-Being Index (CWI), released this month by the Foundation for Child Development, reveals some startling statistics about how America’s children may be weathering the Great Recession. In 2010, the Great Recession may well wipe out almost all progress made since 1975 for children in the CWI’s Family Economic Well-Being Domain, which brings together measures of children in families living beneath the poverty line, median family income, parental employment, and health insurance coverage. Among the more concerning findings from this year’s
CWI report:
- More than 1 in 5 kids currently live in poverty, according to projections, an increase of 5 percent in only 4 years. A related analysis, issued by our foundation, shows that poverty rates in California may be increasing by even greater amounts.
- Risky behavior, including violent crime and illegal drug use, are anticipated to increase.
- Reliance on cheap food with low nutrition may worsen the child obesity epidemic.
Also, although many measures point to a slowly recovering economy, the CWI shows a lag between when a recession first hits and its eventual impact, which means deteriorating conditions for children through the end of this year – or longer.
The researchers at Duke University who prepared this report also developed a similar index for California that projected that the Great Recession would leave a long-lasting impact on children in the form of sustained high levels of poverty. This California Index of Child and Youth Well Being, commissioned by the Lucile Packard Foundation for Children’s Health, employs measures from kidsdata.org to help illuminate how kids have been faring over time for California and two of the state’s most populous regions, Los Angeles County and the Bay Area.
Posted by Andy Krackov
Tags: Child Health Issues, Data Projects
How Are Kids Faring in CA’s 2nd Biggest County?
The Children’s Initiative recently released the 2009 edition of the San Diego County Report Card on Children and Families, a summary of the overall health and well being of children, youth, and families in the state’s 2nd biggest county, as measured by child population.
Among the highlights from the report: Although San Diego County child poverty rates are lower than both state and national averages, the rate increased to 16.6 percent of children in 2008 – the highest in the county since 2000.
Some other notable trends from the report include:
- 93 percent of families reported having health care coverage for their children, on par with state averages and well above national averages.
- Domestic violence and child abuse trends are improving, but county rates still remain above the state average. Also, child victims of violent crime have dropped only slightly.
- Despite annual fluctuations, motor vehicle crashes involving DUIs among drivers ages 16-20 are still at the same level as they were in 1996. And DUI arrests among adolescents in this non-legal drinking age group actually are increasing.
The 2009 Report Card also offered 10 recommendations focused on prevention and intervention, including:
- Intensive home visiting of vulnerable families to improve parenting skills and reduce child abuse, neglect, and repeat teen births.
- Closely monitoring school attendance; providing after school programs to help prevent substance abuse; and restoring driver education in schools to reduce DUI cases.
- Improving parent-to-teen communication. Teens reporting good relationships with parents are less likely to engage in truancy, substance abuse, DUI, and crime, the report notes.
- Raising the economic status of poverty-stricken families through health and housing benefits, as well as job training and educational opportunities.
Kidsdata.org has long been affiliated with children’s reports, particularly those in San Mateo and Santa Clara counties, so we know how vital such reports can be in drawing local attention to how kids are faring, and focusing the community on related improvements. If you’re at work on – or recently have released – a summary report on local children, please let us know by adding a comment/link below.
Posted by kidsdata.org
Tags: Data Projects
Just Added to Kidsdata.org: Dating Violence and Teen Sexual Health Data
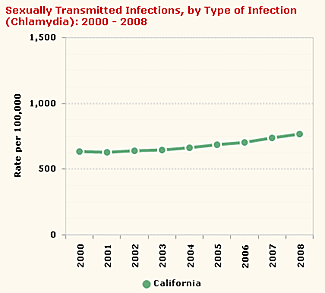 What do we know about dating and sexual health among California adolescents? Here are some highlights: Four out of five teens ages 14-17 say they have not had sex. About 5% of California’s 7th, 9th, and 11th-graders report that they have experienced physical violence in a dating relationship. And chlamydia rates among California’s youth ages 10-19 increased by roughly 20% from 2000 to 2008.
These and other local data on teen sexual health and dating violence now are available on kidsdata.org. Dating violence data come from the California Healthy Kids Survey (CHKS), a statewide survey of students that was developed and is administered by WestEd for the California Department of Education, while the teen sexual health data have two sources – the California Health Interview Survey and the California Department of Public Health.
View Local Data on Dating Violence and Teen Sexual Health
- Youth Experiencing Dating Violence in the Last Year – for School Districts Statewide
By Gender and Grade | By School Connectedness | By Race/Ethnicity
- Selected Facts About Dating Violence
- Teens Who Have Not Had Sex (data available only for CA’s 9 most populous counties)
- Selected Facts About Teen Sexual Health
Posted by kidsdata.org
Tags: New Data, Statewide Expansion
The Quest for Local Data
 On kidsdata.org, we offer data down to the city or school district level. But we often hear that, while useful, those data just aren’t local enough for some purposes.
Last week, we presented kidsdata.org at the 22nd annual Demographic Workshop at USC. This year’s conference focused on the future of California’s children, and brought together key groups of demographers, economists, city planners, and children’s health experts from across the state.
At this conference — and during our many other trips to the Los Angeles area — we hear that LA in particular needs more local data. The vast diversity within the county — as well as it’s sheer geographic size — mean that information about particular communities cannot be derived from data at the county level. Even within school districts or cities, socioeconomic diversity exists.
In LA County, we know that data would be valuable at the zip code level, or by Service Planning Area (SPA). Trouble is, many of the most trusted and reliable data sources don’t offer data at that local a level. When those data are available, the resources needed to cut the data that way can be prohibitive.
But there are a couple of resources that may be helpful. Try HealthyCity, or AskCHIS for local data.
Do you face this issue in your work? If you know of data sources that offer zip code — or even more local — data, please note them here, and be a resource for your colleagues working on behalf of kids.
Posted by Felicity Simmons
Tags: Data Challenges


