Using Kidsdata.org to Make Your Case
You probably know that kidsdata.org can be a valuable resource for making your case on behalf of kids — whether you are working on a grant proposal, presentation, advocacy project, or other efforts. Here are some tips from our foundation on how kidsdata.org can help with grant proposals, in particular:
Making Your Case
Here’s a common way to organize making a  case for the need:
1) Who are the people in need?
2) What is the need?
3) Evidence to support the claim.
Proposals typically include facts about the population or community to be served and the issues to be addressed. When providing those facts, it’s important to provide context for the data. Context can mean different things – for example, it can mean putting your data in a larger geographic context by showing how your community compares to the county or state as a whole. Or, you can provide context by showing how a specific issue has changed over time; or by explaining why these data are important and what they mean.
Writing Your Proposal
In general, it’s important to spell out the key points you want to make, and explain assumptions. Make it easy for the funder to follow the train of thought and pick up your key points.
Funders want to see data as relevant as possible to the focus of the proposal. When the exact data you need are not available, it’s helpful to state that and then provide what is available. For example, if data aren’t available for the city you’re serving, school district or county-level data may be an acceptable replacement.
Use the best possible data, and explain the connection between the data you are including and what you are proposing to do. And always include the source. That will add credibility to your proposal.
Kidsdata.org Can Help
Kidsdata.org provides a wide range of specific facts about children and families, the particular issues they face, and about local communities – as well as the contextual information noted above.
Another type of data often necessary in proposals is data on program effectiveness; that is, citing research/data to demonstrate that your proposed program is likely to succeed. While providing info on program effectiveness is not the primary focus of kidsdata.org, the site has a Resources section with links to articles/research that may help you find evidence to support your program.
If you can’t find what you are looking for or if you have questions about the site, please post any questions on our Data Questions page.
Posted by JoAnna Caywood
Post Comment
Cancer, Health Care, Substance Use News Noted in August Kidsdata News Roundup
The latest Kidsdata News Roundup now is available — read it here.
A few key items:
Alcohol, Tobacco, and Other Drug Use
Anti-Smoking Efforts Compete Against Childhood Obesity for Attention and Funding
(NY Times, 7/27/10, by Wilson)
Health Care
Health Insurers Win Concession on Coverage for Children; Allowed to Set Limited ‘Open Enrollment’ Periods
(SF Chronicle, 7/28/10)
High School Dropouts
Teens with ADHD More Likely to Drop Out of High School, Study Shows
(CNN, 7/28/10)
Weight
Study: Obesity Drops Among Kids in School-Based Health Program
(NY Times, 7/12/10, by Rabin)
Know of news that we should include in our next edition of the Kidsdata News Roundup? Leave a comment.
Posted by Felicity Simmons
Post Comment
Latest County Report Shows Smoking, Teen Pregnancy Down but Obesity, Diabetes Up
 The Santa Clara County Public Health Department recently released its 2010 report on the overall health of adults and children in the county. Although there was a marked drop in smoking and teen pregnancy, obesity and diabetes in both adults and children are on the rise, and about 25 percent of students in middle and high school are overweight or obese.
County Health Officer Dr. Marty Fenstersheib notes that this kind of report can help create community action to improve health practices throughout the county. Tracking data over time is particularly important for the health of children. When issues are identified, the right intervention at the right time sometimes can prevent serious problems.
See more data for Santa Clara County at www.kidsdata.org/santaclara
Posted by kidsdata.org
Post Comment
California Ranks 19th in KidsCOUNT Data Book
The 2010 KidsCOUNT Data Book was released today by the Annie E. Casey Foundation. Using 10 key child health indicators, the Data Book ranks states according to how they’ve fared in those measures since 2000 — and also provides national comparisons.
This year, California ranks 19th — a slight improvement over the rank of 20 in the 2009 Data Book. Since 2000, our state has improved in nearly every area featured: infant mortality, child and teen death rates, teen birth rates, and others.
Some areas have seen significant improvements — such as a 40% decrease in the teen birth rate from 2000-2008; and a 20% decrease in the death rate for children ages 0-14.
However, there are two areas that do not show improvement — low birthweights and single-parent families. According to KidsCOUNT, nearly 7% of babies in California were born at a low birthweight — an increase since 2000, but lower than the national average of 8.2%. In 2008, 32% of California children lived in single-parent families, which is an increase of 7% since 2000, but in line with the national average. (According to kidsdata.org, family structure can be an important factor in a child’s physical health and mental health, educational attainment, and poverty status. Studies have shown that single-parent families are more likely than two-parent families to have lower incomes.)
Overall, children’s health in California is improving, according to the 2010 KidsCOUNT Data Book. Our Foundation’s Index of Child and Youth Well-Being also found that child well being improved from 1995 to 2006, but notes that the recent economic downturn threatens those gains.
- To see all the data available for California through the KidsCOUNT data center, visit http://datacenter.kidscount.org/ca.
- Visit kidsdata.org to see data for your community on low birthweight babies, and single-parent families.
Posted by Felicity Simmons
Tags: Data Projects, Data Sources
Short Term Gains, but Long Term Challenges for Federally Funded Children’s Programs
 Two reports released at the recent Children’s Budget Summit paint a less-than-hopeful picture of the future of federal spending for children’s programs. The reports were produced by First Focus, a bipartisan organization advocating for children and families.
The first report, the Children’s Budget 2010, offers a guide to federal spending on children. The budget notes that spending on kids programs has increased in 2009 and 2010, largely due to dollars from the American Recovery and Reinvestment Act. (a.k.a. the Federal Stimulus) Even with this additional funding, spending on kids programs (ranging from health and education to child welfare and juvenile justice) remains at less than 9% of the federal budget.
A second report, Kids’ Share 2010, noted that overall spending on children’s programs has declined by 25% since 1960, and 10-year projections show a continued decline.
Despite a temporary boost from the Stimulus, children’s programs across the country face an uphill battle. Unless Congress makes children a higher priority and this increase in funding is maintained, these programs will need to cut back to pre-2009 budget levels, according to First Focus President Bruce Lesley.
How has your organization been affected by the Federal Stimulus?
Posted by Felicity Simmons
Tags: Child Health Issues
Fewer Than One in Three Students Proficient in Algebra I
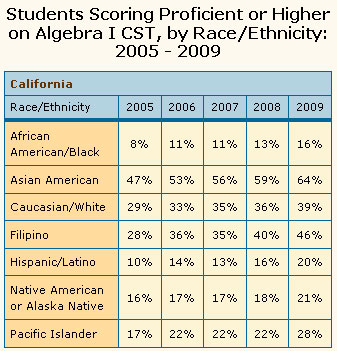 Over the past four years, California has seen Algebra I proficiency increase among students in grades 7-11, but the stubborn fact remains that fewer than one in three students is considered proficient.
Research has shown that competence in mathematics is crucial for functioning in everyday life, and mastering algebra is associated with readiness for the workplace and higher future earnings.
Disparities by race/ethnicity and socioceconomic status are pronounced. Statewide, Asians are four times more likely to be proficient in Algebra I than African Americans, and three times more likely to be proficient than Hispanics.
While such gaps between different socioeconomic and ethnic groups have long existed not only in California, but nationwide, a recent report indicates that some schools are having success reducing the math achievement gap.
What kinds of strategies does your school or district use?
Posted by kidsdata.org
Tags: New Data, Statewide Expansion
Despite Steady Increases Statewide, Fewer than Half of CA Third Graders Proficient at Reading
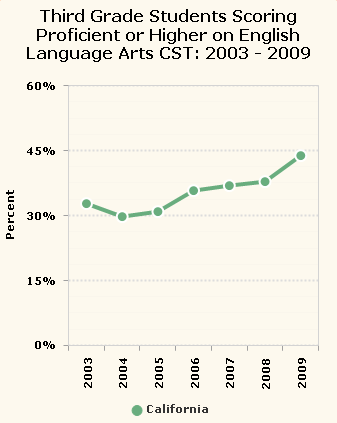 One of the leading indicators of students’ academic progress and likely school success is their level of reading at the end of third grade. In California, although steady increases in reading proficiency have been seen since 2005 across all ethnic and socioeconomic groups, fewer than half of California third graders score proficient or higher on the state’s English language standardized test.
Despite increases in reading proficiency across all groups, substantial disparities remain. For instance, fewer than one in four Latino third graders read at or above the 50th percentile, the lowest of any racial/ethnic group in CA. These gaps also exist between low-income and higher-income students.
The Annie E. Casey Foundation also recently released a report, Early Warning! Why Reading by the End of Third Grade Matters, which notes that California ranks 46th in the percentage of 4th-graders who are not proficient in reading.
Children need a variety of support beginning at an early age in order to read proficiently by third grade. They must be ready to learn when they enter school, which means having access to opportunities to help them build basic cognitive, social, emotional and physical skills. Children who do not have access to such opportunities may need extra support to catch up; otherwise, they tend to fall further behind over time.
Do you see these trends in your school or district? Has your school or district found effective measures to help close these proficiency gaps?
Posted by kidsdata.org
Tags: New Data, Statewide Expansion
Could You Live Off of California’s Minimum Wage?
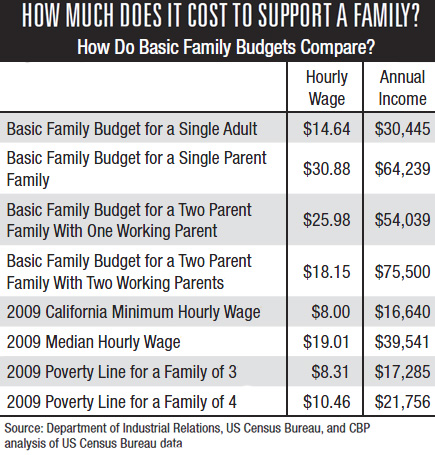 A new report from the California Budget Project brings to light an issue that has a profound effect on the health and well being of children — living off minimum wage in California may be next to impossible.
According to the report, a single parent family with two children needs an annual income of $64,239 – equivalent to an hourly wage of $30.88 for a 40-hour workweek – to provide the basics: child care, health coverage, food, rent, utilities, transportation, and other modest expenses.
Yet the minimum hourly wage of $8 per hour generates an annual income of $16,640 for a 40-hour workweek – less than half of what’s needed to get by, according to the report. The impact on child well being can be wide-ranging. Children living in poverty are more likely to go hungry, reside in overcrowded or unstable housing, be exposed to violence, and receive a poorer education. Poverty also exposes children to chronic stress, which can hinder their physical, social, and emotional development. Children in families with inadequate income may face more substantial health problems than those in families with enough to meet basic needs.
The report is worth a look. In addition to offering statewide numbers, it includes data for all counties in California.
Posted by kidsdata.org
Tags: Child Health Issues, Data Projects
New Feature: Add Graphs to Your Website That Update Automatically!
Just launched on kidsdata.org — a new way to share data.
You already were able to download data in to Excel, copy charts into Word or Powerpoint, and print a pdf summary of data. Now, you can add a graph to your website or blog. Simply find the data you’re interested in, customize the chart with your preferences, and click “embed” in the top right.
You can embed any map, table, or graph from kidsdata.org. The chart will update whenever data are added to kidsdata.org. Here’s an example:
Posted by Felicity Simmons
Tags: New Features, News About Kidsdata.org
Children’s Network of Solano County Uses Kidsdata.org in 2010 Report Card
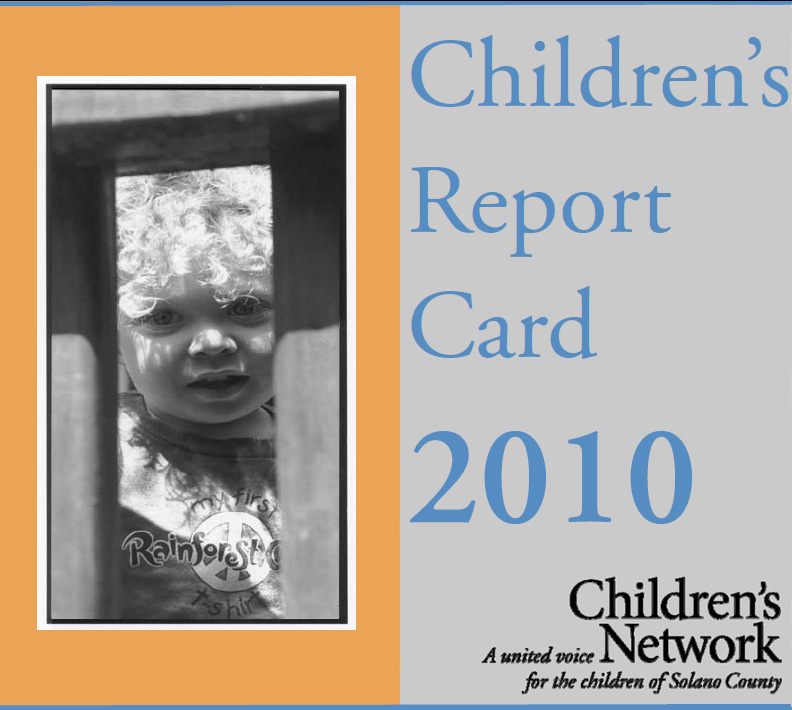 To help the Solano County Board of Supervisors understand and address the needs of the county’s 108,000 children, the Children’s Network of Solano County has published a Children’s Report Card regularly over the past decade.
The 2010 edition offers a number of recommendations based on data in the report – preserving the basic infrastructure of government services provided to kids; investing more in prevention and early intervention; and involving community-based organizations and advisory councils in planning.
The report also references facts and figures from kidsdata.org numerous times, including data ranging from family economics to emotional, behavioral and physical health.
Since the beginning of the recession, Solano County families have experienced economic hardships in the form of high unemployment, widespread home foreclosures, and dwindling budgets for social programs, as the report notes. A report card helps elected officials and policymakers understand the current impact of these developments and plan for the future.
Solano County’s 2010 Children’s Report Card is a terrific example of how people working on behalf of children can use kidsdata.org. We’d like to thank the Children’s Network of Solano County for using kidsdata.org, and encourage all organizations to reference kidsdata.org in their research, reports, and grants.
Posted by kidsdata.org
Tags: Data Projects, News About Kidsdata.org


