

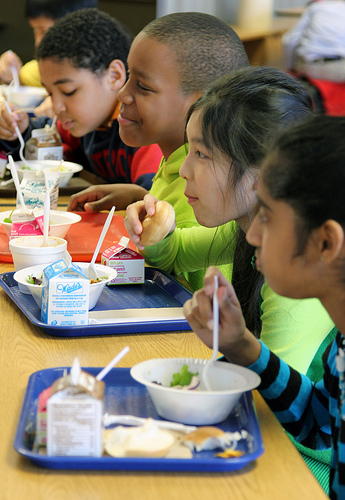
National Children’s Dental Health Month: For Some California Kids, Dental Care Remains Elusive

As National Children’s Dental Health Month winds down, we’re highlighting a number of developments relating to children’s oral health and access to dental care.
In recent news, Covered California, the state’s health insurance exchange, will require children’s health plans available on the exchange to include pediatric dental coverage starting in 2015. Also, dental coverage for adults, which often has an impact on whether their children receive regular dental care, will be partially restored under Denti-Cal beginning May 1.
The Children’s Dental Health Project and Families USA have just released a new consumer guide for parents trying to evaluate dental coverage on the exchanges in California and nationwide.
And the Lucile Packard Foundation for Children’s Health has published a new issue brief, Dental Care Access for Children in California: Institutionalized Inequality, that examines shortcomings in the state’s social safety net of publicly funded health care services related to dental care.
So how are California children faring when it comes to getting the dental care they need? That all depends on their income, insurance status, race/ethnicity and where they live.
While an estimated 73% of California children ages 2-11 and 78% of youths ages 12-17 had a dental visit in the past six months, approximately 10% of children between the ages of 2-11 had never had a dental visit. Some counties reported that more than one-fifth of children have never been to the dentist by the age of 11, according to 2011-12 data from kidsdata.org.
Tooth decay is the most common chronic disease among children ages 6-18, and cavities among even younger children are on the rise, according to a new report from the American Academy of Pediatric Dentistry. Tooth decay and other oral diseases disproportionately affect low-income children, children of color, and the uninsured; these children are less likely to receive routine dental check-ups. The American Academy of Pediatrics recommends dental visits every six months.
Regular dental care is one of the best forms of prevention available, so it is important that all kids have ready access to high quality, affordable dental care.
For more information about dental care in California, see these measures on kidsdata.org:
Length of Time Since Last Dental Visit
Unmet Needs for Preventive Dental Care Among Children with Special Health Care Needs
More Resources:
National Children’s Dental Health Month
California HealthCare Foundation: Dental Health
Children’s Dental Health Project
Photo credit: Dillweed via flickr
Posted by Amy Lam
Post Comment
Field Poll: When It Comes to Kids’ Health Risks, Public Now More Worried About Healthy Eating, Exercise than Drugs or Violence
A new Field Poll shows that public concerns over the biggest threats to children’s health are shifting to nutrition and exercise, rather than drugs or violence.
The new Poll, which surveyed more than 1,000 California voters in late 2013, found that:
…the proportion of Californians citing unhealthy eating or a lack of physical activity among kids’ top two health risks has grown over the past ten years to 59%, and now far outranks the next highest ranking concern, illegal drug use (43%) by a considerable margin. Next most frequently mentioned is the threat of violence to children cited by 31%.
Their concerns may be well-founded. According to kidsdata.org:
- Only about 25% of California 5th graders in public schools meet state physical fitness standards for students.
- Just over half of California 5th graders in public schools are considered to be at a healthy weight or underweight.
- About 41% of children consume one or more sugary drinks (soda, juice) daily
- About 37% of children reportedly eat two or more servings of fast food each week
For more comprehensive information on children’s weight, nutrition and fitness – including how California children are faring and policy implications, check out these links:
Kidsdata.org Topic Summary: Physical Fitness
Kidsdata.org Topic Summary: Nutrition
Kidsdata.org Topic Summary: Weight
Photo credit: USDA via Flickr
Posted by Barbara Feder Ostrov
Post Comment
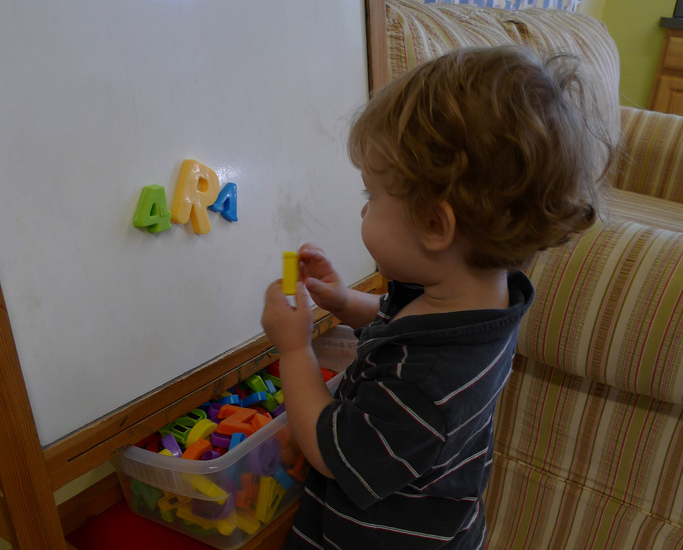
How Will California’s Children’s Health Insurance Programs Evolve under the Affordable Care Act?

Approximately 95% of California children have health insurance coverage, most through their parents’ employers or through Medi-Cal, the state’s Medicaid program. As the Affordable Care Act (ACA) is implemented in 2014, some children and families will see changes to their plans and new opportunities for coverage.
Meanwhile, the State is at a crossroads, and must determine if and how to alter existing programs and systems to better serve children. Several questions arise in the wake of ACA implementation: what will be the role of the numerous children’s health programs post ACA, what can be done to ensure adequate coverage of vulnerable populations, including the remaining uninsured, and how can insurance programs be better coordinated for optimum efficiency and accessibility?
A new series of issue briefs, prepared by Insure the Uninsured (ITUP) and funded by the Lucile Packard Foundation for Children’s Health, examines the impact of the ACA on health insurance coverage for children in California, and offers recommendations on how the state might alter existing programs and systems to better serve children.
The briefs include:
Executive Summary
Part I: Inventory of Children’s Health Programs
Part II: Issue Diagnosis – Patient Care Challenges
Part III: Issue Diagnosis – Evolutionary Challenges
Part IV: Policy Options & Recommendations
Posted by kidsdata.org
Post Comment
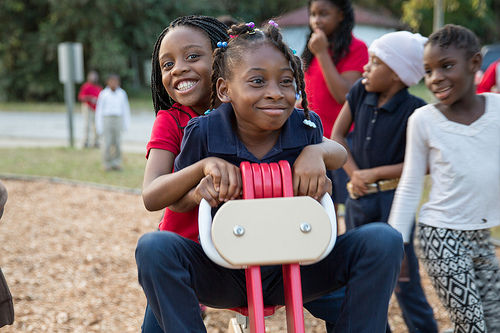
Upholding Dr. Martin Luther King’s Vision of Equity for Children

This guest post is written by Cassandra Joubert, ScD, director of the Central California Children’s Institute at California State University-Fresno.
As we celebrate Dr. Martin Luther King’s birthday and his life’s work to achieve fair and equal treatment for the disenfranchised, we pause to reflect on the persistence of racial and ethnic disparities in child well being, and how we can more intentionally activate his vision today.
Significant racial/ethnic differences persist in children’s access to quality health, dental, and mental health care, proper diagnosis and treatment for conditions such as ADHD and autism, birth outcomes, and access to preschool and quality education.
In the San Joaquin Valley, we are particularly concerned about the impact of race and ethnicity on boys and men of color. The Central California Children’s Institute’s data chart book, Boys and Men of Color: Fresno County, California, documents racial/ethnic disparities in socioeconomic status, health care utilization, safety and educational attainment.
The vision we hold for children of the San Joaquin Valley, as articulated in the 2010 Central California Children’s Agenda, is that “(our) region prioritizes and ensures a healthy and prosperous future for all children and families.” Indeed, as we celebrate Dr. King’s birthday, we realize that in our nation and region, efforts to achieve equity must continue.
In 2014, the Children’s Institute will increasingly apply an equity lens to our work. We will be revamping one of our key publications, “Our Regional Children’s Agenda: Child Well-Being Indicators,” to not only stress racial/ethnic disparities in childhood outcomes, but also call attention to structural barriers to equity. Inequities in access to high quality, culturally appropriate health care; livable, safe neighborhoods and environments; preschool education; and healthy foods produce disparities in child well-being.
Not only will we document racial/ethnic disparities in outcomes (i.e., lower academic achievement, higher juvenile arrest rates, more untreated mental health challenges, etc.), but we also will attempt to secure data that demonstrate structural inequities in opportunity, services and supports that require policy change.
As an example, inequities in preschool availability are a structural barrier, which, if changed, would greatly improve kindergarten readiness and academic achievement for children of color.
According to kidsdata.org, the percent of third-grade students in the eight counties of the San Joaquin Valley who scored proficient on the English Language Arts California Standards Test ranged from 36–44% in 2012, well below the state’s 48%. Further, kidsdata.org shows that with the exception of one county, the availability of child care was below the potential demand in 2012.
By calling attention to the need to expand the availability of affordable, high quality, center-based care, we hope to accelerate academic achievement and prosperity for our entire region. The Children’s Institute is a member of the San Joaquin Valley team of the national Place Matters health equity movement led by the Joint Center on Political and Economic Studies. The Place Matters team is a key partner in this work.
Fifty years ago, Dr. King said: “Now is the time to open the doors of opportunity to all of God’s children” and “Injustice anywhere is a threat to justice everywhere. We are caught in an inescapable network of mutuality, tied in a single garment of destiny. Whatever affects one directly, affects all indirectly.”
In Central California, we are sharpening our lens on equity to propel Dr. King’s vision of fairness and democracy for all. For more information about racial equity in child well being outcomes in the San Joaquin Valley, visit www.centralcaliforniachildren.org.
Posted by Guest
Post Comment
Could A Soda Tax in California Improve Kids’ Health?

As California legislators coming back from their holiday break prepare to consider a controversial “soda tax,” a recent study examines how a statewide penny-an-ounce tax on sugary drinks might affect adults’ and kids’ health in the Golden State.
The study, published in the journal Public Library of Science One (PLOS), estimates that a penny-per-ounce tax could result in a 10-20% decline in statewide consumption of sodas, sports drinks and other sugar-sweetened beverages. As frequent consumption of such drinks has been linked to child obesity, diabetes and heart disease, this decline is projected to result in a drop in new cases of diabetes and heart disease, yielding population health benefits and cost savings in California.
As Santa Cruz Sentinel reporter Jason Hoppin writes:
Researchers pegged the likeliest savings from reduced diabetes cases at $320 million to $620 million in 10 years. In some scenarios, that figure topped $1 billion when coronary heart disease was factored in…
…The impacts were particularly profound within minorities and low-income populations, which have been disproportionately affected by chronic diseases linked to dietary intake.
The PLOS study doesn’t differentiate between adults and children in terms of health impact, but statewide, an estimated 41% of children ages 2-17 drank one or more sugar-sweetened beverages every day, according to 2011-12 data on kidsdata.org.
More than 70 percent of African American and Latino children and youth ages 12-17 in California reported drinking one or more sugar-sweetened beverages every day, compared to 56 percent of white children in the same age group.
To see California kids’ consumption of sugary drinks at the county and state levels – as well as diabetes-related hospitalizations and figures on healthy weight – check out these indicators on kidsdata.org:
Children Drinking One or More Sugar-Sweetened Beverages Per Day (County Level Data)
By Age and Race/Ethnicity (California Only)
Students Who Are at a Healthy Weight or Underweight, by Grade Level (2011-2012)
by Race/Ethnicity and Grade Level
Diabetes-related Hospitalizations, By County
Posted by kidsdata.org
Post Comment
Fifty Years After The “War on Poverty”: How California Children Are Faring

As we mark the 50th anniversary of Lyndon Johnson’s War on Poverty this month, it’s a good time to take stock of the economic status of California children and their families.
While the national poverty rate declined from 26 percent in 1967 to 16 percent in 2012, it has been harder to move the needle on child poverty in California in recent years.
The state’s child poverty rate in 2012 – 22.5 percent – was about the same as it was in 1990, although it dipped to a low of about 16 percent in 2001, according to an analysis by the California Budget Project.
Why does this matter? The national research center ChildTrends highlights the five ways poverty harms children’s health and well being.
Several measures tracked by kidsdata.org show other ways in which California children and their families continue to struggle despite the recovering economy:
- Nearly 30 percent of California children lived in “crowded households” – a marker of poverty and high housing costs – in 2011.
- More than 220,000 children in the state’s public schools were homeless in 2011.
- Nearly 3.5 million public schoolchildren qualified for free or reduced price school meals in 2012.
See more state and county-level data on California child poverty and family income on kidsdata.org:
Children in Poverty (Regions of 65,000 Residents or More)
Children in Poverty – Supplemental Poverty Measure (State & U.S. Only)
Student Eligibility to Receive Free or Reduced Price School Meals
Median Family Income (Regions of 65,000 Residents or More)
Self-Sufficiency Standard, by Household Type
Families Living Below the Self-Sufficiency Standard
Adequacy of Income to Meet Basic Needs
Households with a High Housing Cost Burden (Regions of 65,000 Residents or More)
Children Living in Crowded Households, by County (65,000 Residents or More)
Related Content:
- A Less-Noticed Consequence of Child Poverty: Poor Health as Adults, Kidsdata.org advisory
- Poverty in the Golden State: Where California Stands 50 Years Since the War on Poverty Began, California Budget Project
- Child Poverty in California, California Public Policy Institute
photo credit from flickr.
Posted by kidsdata.org
Post Comment
Children Now Issues 2014 California Children’s Report Card: A C- on Developmental Screening, D+ on Oral Health
Children Now’s 2014 “California Children’s Report Card” was released this week, with grades ranging from B+ to a less impressive D on how the state performs on child health, education and welfare indicators.
While the Oakland-based advocacy group praised recent changes in state education funding, Children Now gave only a C- grade for California’s performance in timely developmental and behavioral screening. The report card notes:
- No more than 30% of developmental disabilities or delays are identified before children enter kindergarten.”
- Within 1 year, 72% or 1.7 million of California’s youngest children did not receive any of the developmental screenings that are recommended by the American Academy of Pediatrics.
Children Now handed out an even worse D+ grade for access to oral health services, noting that more than a quarter of California children have untreated tooth decay. California students miss an estimated 874,000 days of school each year because of dental problems, the group noted.
To see the report card, click here.
To learn more about data on California children with special health care needs, click here.
To learn more about California children’s dental health, click here.
photo credit from flickr.
Posted by Barbara Feder Ostrov
Post Comment
Invisible Dasani: New York Times Series on Homeless Girl Sparks National Conversation on Homelessness, Poverty
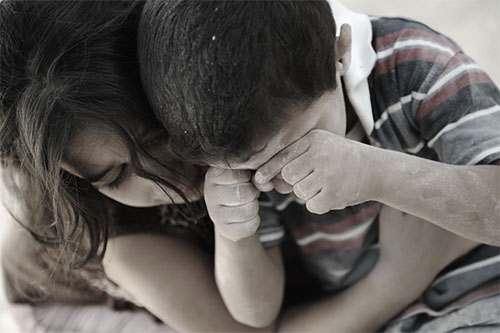
A searing New York Times examination of one homeless girl’s life in New York City is calling national attention to poverty and homelessness and their long-term impact on children. As author Andrea Elliott writes:
One in five American children is now living in poverty, giving the United States the highest child poverty rate of any developed nation except for Romania.
This bodes poorly for the future. Decades of research have shown the staggering societal costs of children in poverty. They grow up with less education and lower earning power. They are more likely to have drug addiction, psychological trauma and disease, or wind up in prison.
The five-part series delves into the conditions faced by 11-year-old Dasani, her seven brothers and sisters and her troubled parents, all living in a single room in a decaying family shelter in Brooklyn. Dasani and her siblings are among more than 22,000 homeless children living in New York City.
In California, more than 220,000 public school students were homeless in 2011. About 23 percent of California’s children live below the federal poverty level, echoing national trends. However, families can earn well above the poverty level and still struggle to make ends meet. In 2012, about 58% of California’s public school students qualified for free or reduced price school meals, a program for low-income children.
More information on child poverty and homelessness can be found at kidsdata.org:
Homeless Public School Students (California Only)
Student Eligibility to Receive Free or Reduced Price School Meals
Children in Poverty (Regions of 65,000+ Residents)
Children in Poverty (3-Year Estimates for Regions of 20,000+ Residents)
by Race/Ethnicity
Children in Poverty (5-Year Estimates for Regions of 10,000+ Residents)
Children in Poverty – Supplemental Poverty Measure (State & U.S. Only)
by Race/Ethnicity
Children Living Above and Below the Poverty Level (Regions of 65,000+ Residents)
Children Living Above and Below the Poverty Level (3-Year Estimates for Regions of 20,000+ Residents)
by Family Type
Children Living Above and Below the Poverty Level (5-Year Estimates for Regions of 10,000+ Residents)
Median Family Income (Regions of 65,000+ Residents)
Median Family Income (3-Year Estimates for Regions of 20,000+ Residents)
Median Family Income (5-Year Estimates for Regions of 10,000+ Residents)
Income Needed for Self-Sufficiency Standard, by Household Type
Families Living Below the Self-Sufficiency Standard
Posted by Barbara Feder Ostrov
Post Comment
Congressional Briefing: Measuring the Well-Being of Our Children
If you’re in the Washington, DC area, this Congressional briefing is well worth attending. Here are the details:
Measuring the Well-Being of Our Children
Wed., Dec. 11
8:30am – 10am EDT
B-338 Rayburn House Office Building
Washington, District of Columbia 20515
Join Representative Sheila Jackson Lee (D-TX), Representative Ileana Ros-Lehtinen (R-FL), and the Congressional Children’s Caucus, in cooperation with First Focus and the Foundation for Child Development (FCD), to explore the 2013 FCD Child Well-Being Index (CWI).
The CWI tracks 28 Key Indicators of the quality-of-life of America’s children across seven Domains: Family Economic Well-Being, Safe/Risky Behavior, Social Relationships, Emotional/Spiritual Well-Being, Community Engagement, Educational Attainment, and Health. The panel will discuss comprehensive long-term trends since 1975 and Congress’ role in improving the well-being of children.
Opening Remarks
- Mark Bogosian, Communications and Program Officer, Foundation for Child Development
Presenter
- Kenneth C. Land, John Franklin Crowell Professor of Sociology and Faculty Director, Center for Population, Health, and Aging, Duke University
Panelists
- Liz Ryan, President and Chief Executive Officer, Campaign for Youth Justice
- Dave Schrandt, Homeless Liaison, Cypress-Fairbanks School District, Texas
- Bruce Lesley, President, First Focus
To RSVP, click here.
As always, kidsdata.org is here to keep you posted on the latest data on the health and well being of California’s children. To learn more about using kidsdata.org’s state and national legislative mapping tools, click here. Learn more about our new features here.
RELATED CONTENT:
The New Kidsdata: Using Legislative Maps
Posted by kidsdata.org
Post Comment
The New Kidsdata: Using Legislative Maps
After a major upgrade to kidsdata.org, including redesigned maps, it’s a great time to take a fresh look at our legislative mapping tool.
While data sets collected specifically by legislative district are limited, kidsdata.org’s legislative mapping tool makes it easy to overlay legislative district boundaries on maps that show data collected by cities, counties or school districts. These overlays make it easier to see what’s happening in your federal or state legislative district.
It takes less than a minute to create your legislative data map. Here’s a step-by-step guide.
How to Overlay Legislative District Boundaries:
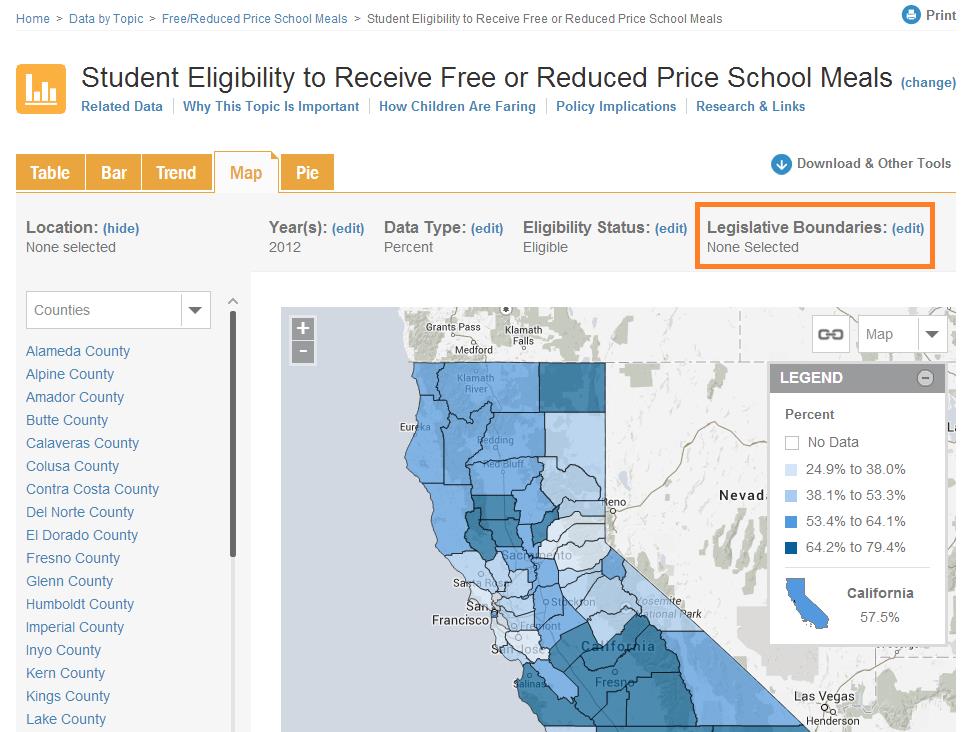
1. Find data of interest to you. Once you are on an indicator page, such as the one below, select the Map tab, and click the “edit” link next to Legislative Boundaries.
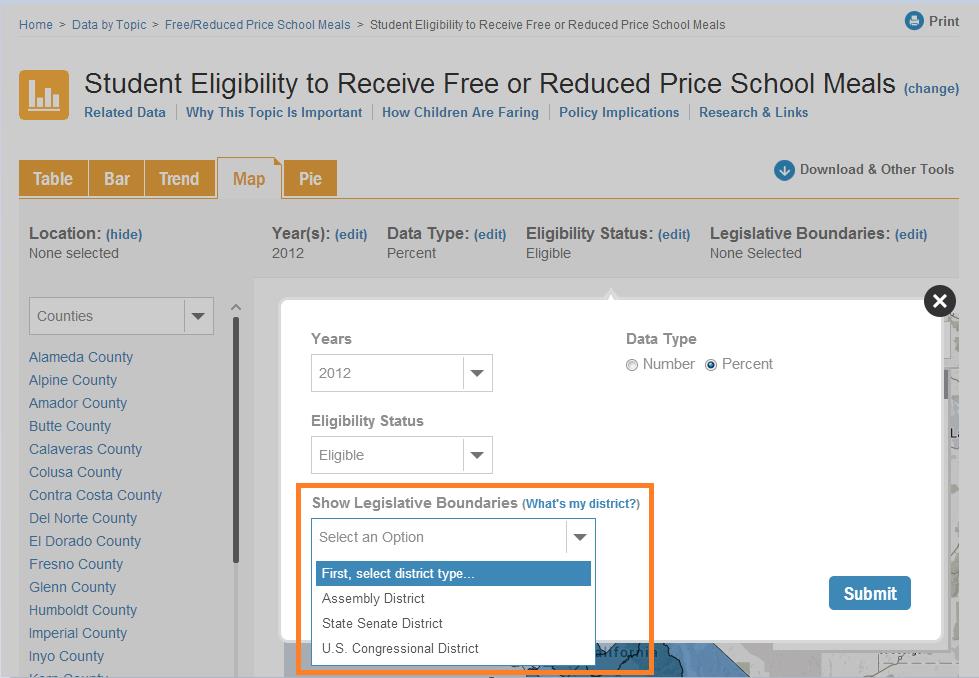
2. Next, select your district type (Assembly, State Senate, or U.S. Congressional districts) under “Show Legislative Boundaries.” Don’t know your district? Hit the “What’s My District?” link.
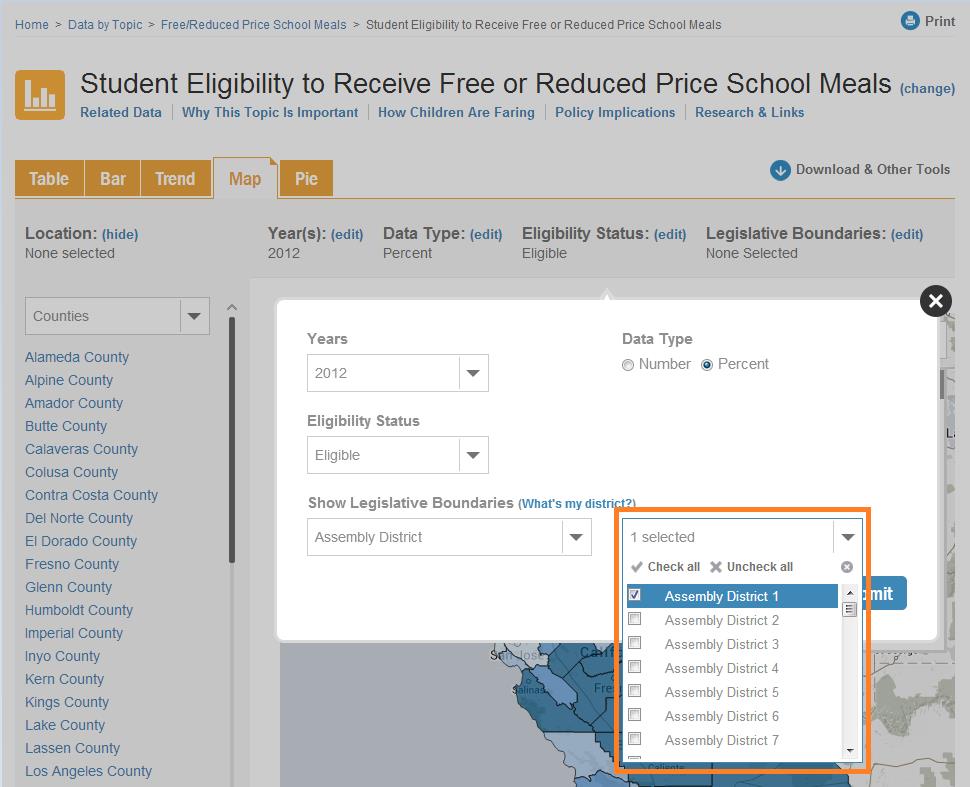
3. Then, select the districts you’d like to see on the map. You can select as many districts as you want, or, click “Check All” to view all districts. When you’re finished customizing, click “Submit” to build your legislative data map.
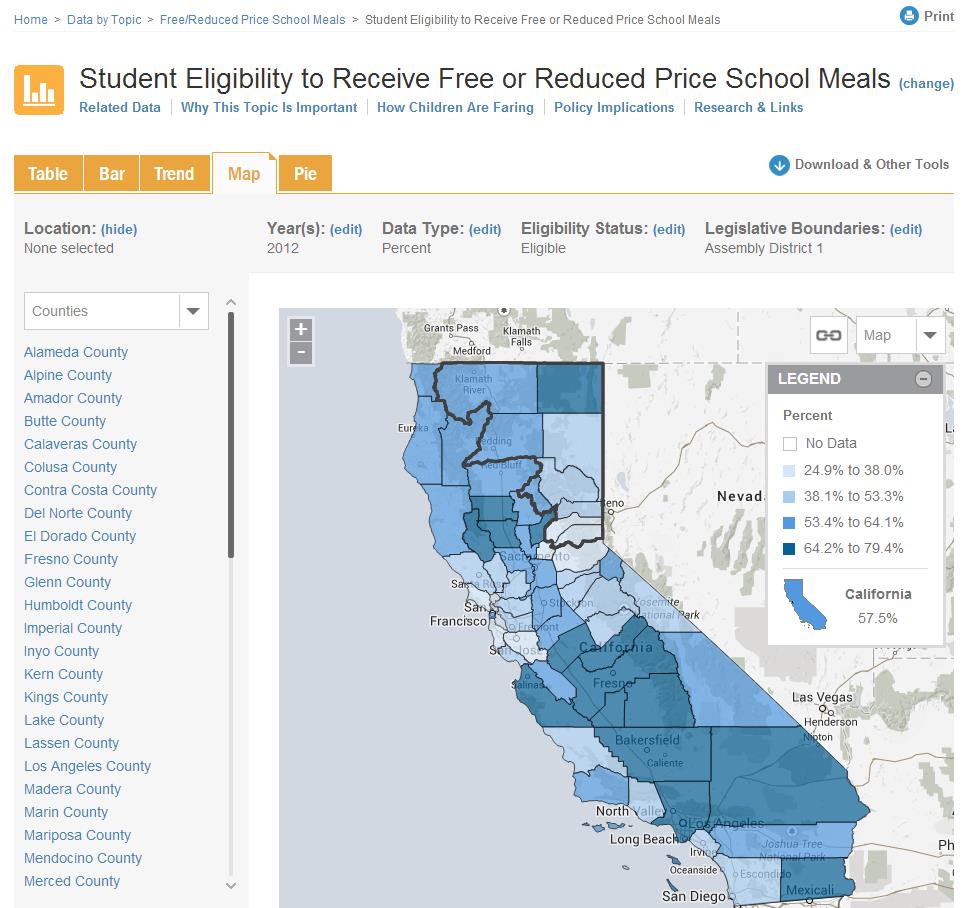
4. View your map! You also can click “Download & Other Tools” to copy or embed your customized map, or generate a PDF topic overview including the map.
If you have questions on how to use this legislative map tool or other aspects of kidsdata.org, please post your question on our blog or contact us directly at [email protected].
Posted by kidsdata.org
Post Comment