

The New Kidsdata: Using Legislative Maps
After a major upgrade to kidsdata.org, including redesigned maps, it’s a great time to take a fresh look at our legislative mapping tool.
While data sets collected specifically by legislative district are limited, kidsdata.org’s legislative mapping tool makes it easy to overlay legislative district boundaries on maps that show data collected by cities, counties or school districts. These overlays make it easier to see what’s happening in your federal or state legislative district.
It takes less than a minute to create your legislative data map. Here’s a step-by-step guide.
How to Overlay Legislative District Boundaries:
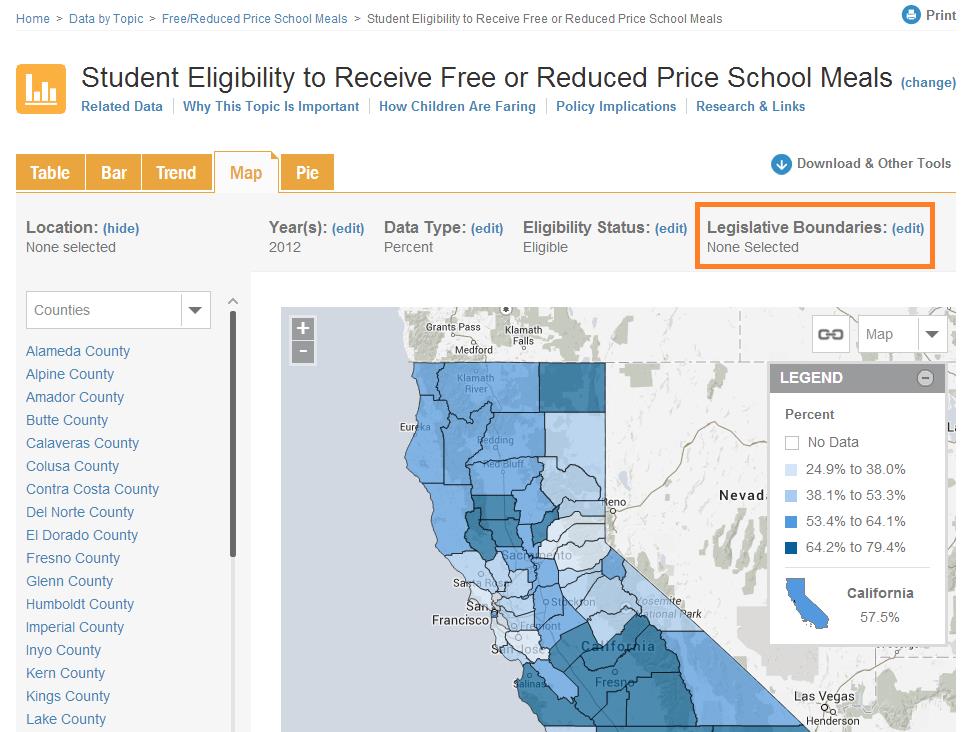
1. Find data of interest to you. Once you are on an indicator page, such as the one below, select the Map tab, and click the “edit” link next to Legislative Boundaries.
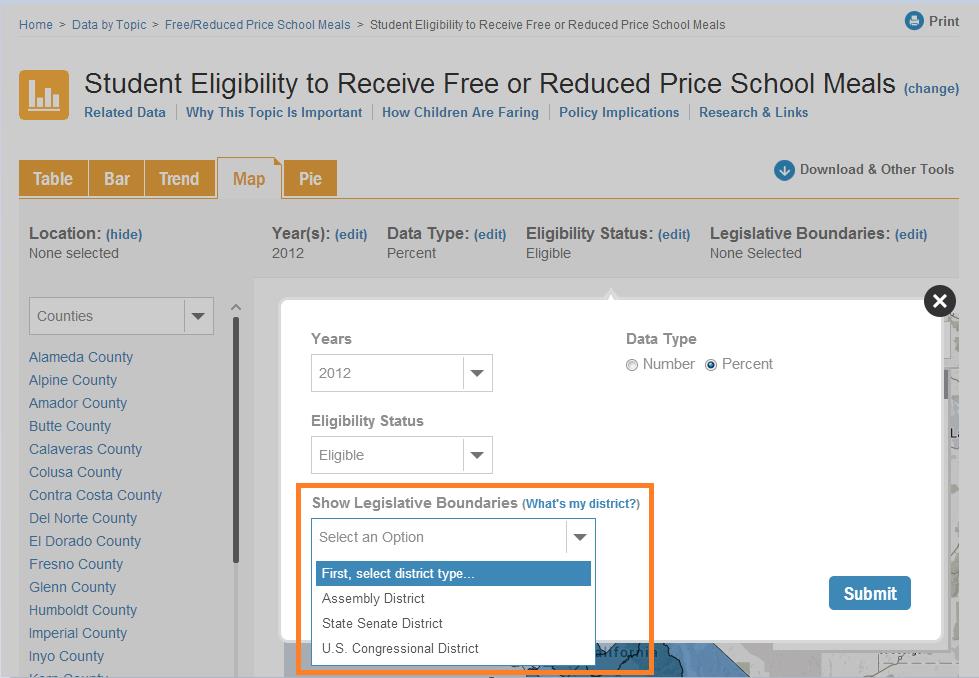
2. Next, select your district type (Assembly, State Senate, or U.S. Congressional districts) under “Show Legislative Boundaries.” Don’t know your district? Hit the “What’s My District?” link.
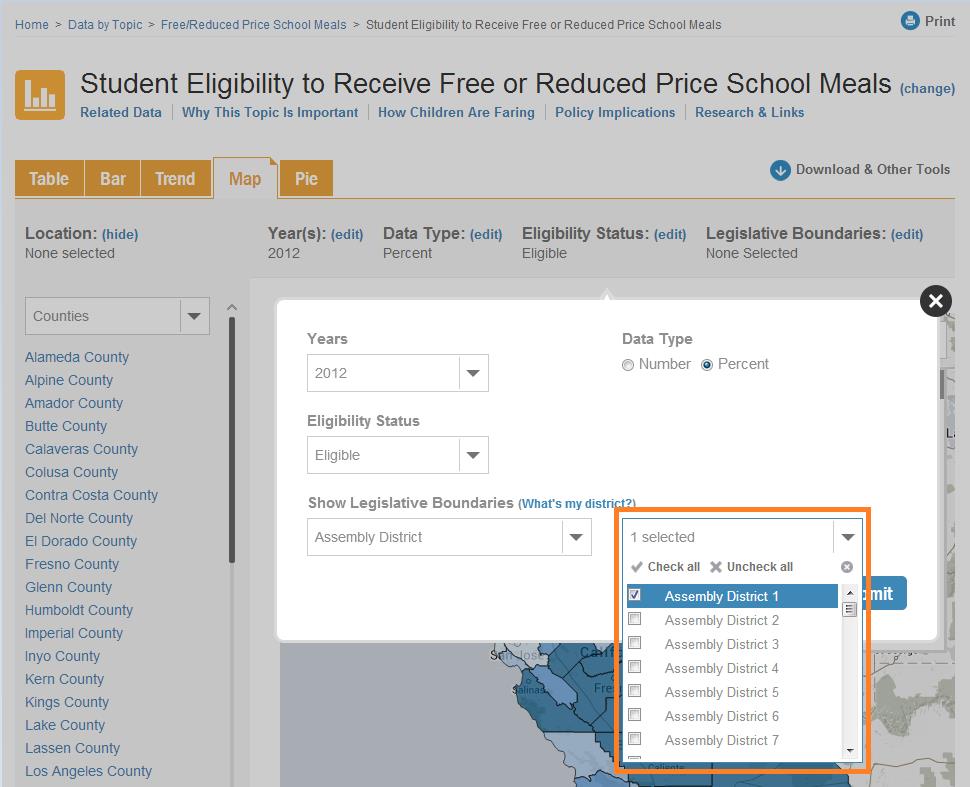
3. Then, select the districts you’d like to see on the map. You can select as many districts as you want, or, click “Check All” to view all districts. When you’re finished customizing, click “Submit” to build your legislative data map.
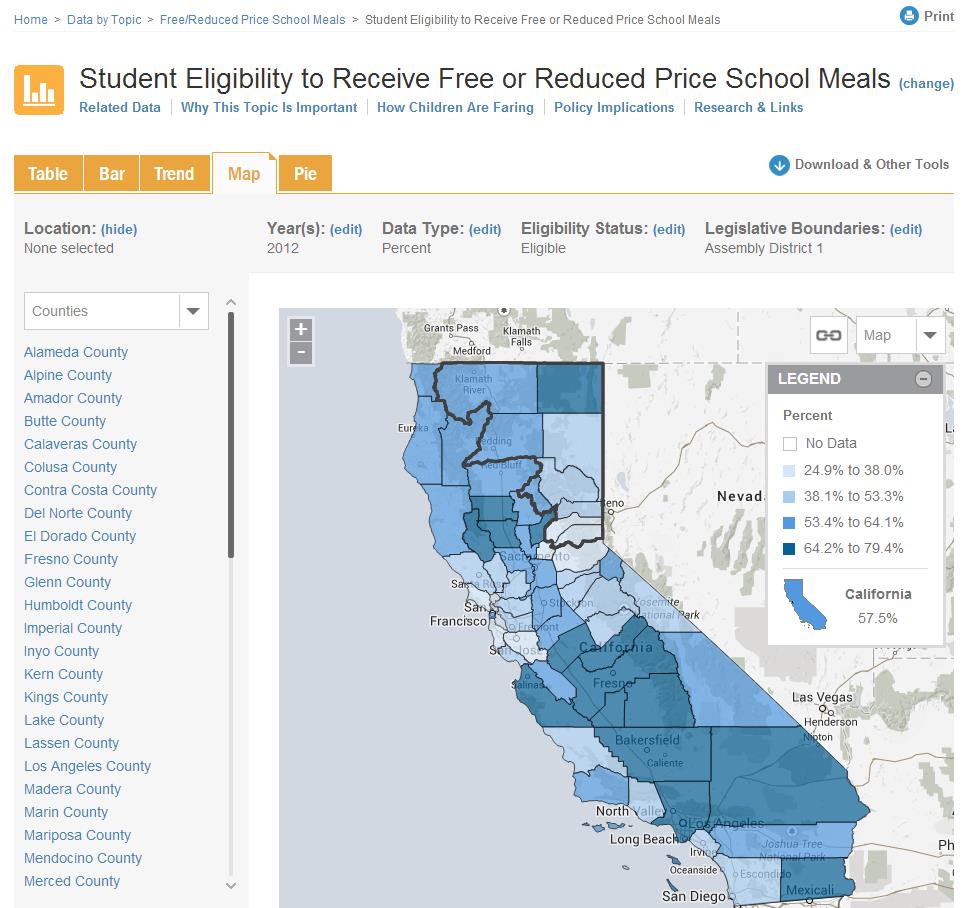
4. View your map! You also can click “Download & Other Tools” to copy or embed your customized map, or generate a PDF topic overview including the map.
If you have questions on how to use this legislative map tool or other aspects of kidsdata.org, please post your question on our blog or contact us directly at [email protected].
Posted by kidsdata.org
This entry was posted on Monday, December 2nd, 2013 at 1:34 pm. You can follow any responses to this entry through the RSS 2.0 feed. You can leave a response, or trackback from your own site.