

New Data: Licensed Child Care in Short Supply for California Kids
At a time when concerns are rising nationwide about the high cost of child care, the California Child Care Resource & Referral Network today released new data about the cost, availability, and need for child care in the state’s 58 counties.
Among the data highlights:
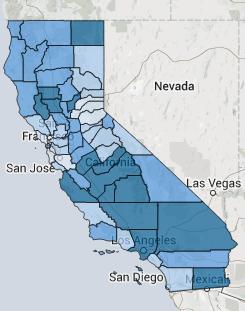
- 2012 data show there are just over 1 million licensed child care spaces available for an estimated 4.2 million children ages 0-12 whose parents are in the workforce. That means three of four children who may need care do not have a licensed child care space. Click here to see how many licensed child care slots there are in your county.
- The average cost in California for full-time infant care in a child care center is $11,461 (click here to see data for your county), according to 2012 data. Nationally, California ranks sixth as the least affordable state for center-based infant care, according to an analysis by the advocacy group Child Care Aware.
- The supply of licensed child care slots in California rose by 22 percent between 2000 and 2008, but has been declining since then.
You can find more data for your county via these links:
Annual Cost of Child Care, by Age Group and Type of Facility
Availability of Child Care for Potential Demand
Availability of Child Care, by Facility’s Schedule and Type of Facility
Number of Child Care Slots in Licensed Facilities, by Type of Facility
Number of Licensed Child Care Facilities, by Type of Facility
Parent Requests for Child Care, by Age
Parent Requests for Evening/Weekend/Overnight Child Care
Posted by Barbara Feder Ostrov
Post Comment
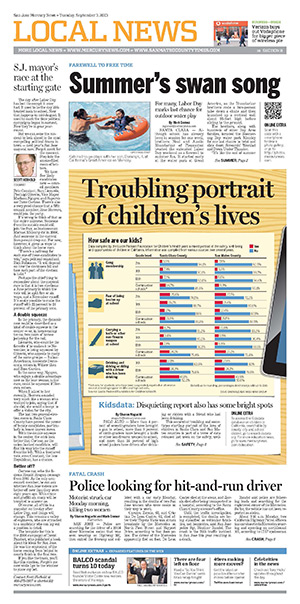
Big Changes to Kidsdata.org
With a new look and many improvements, kidsdata.org now makes it easier than ever to find and use data about the health and well being of California children.
Read on to see what’s new:

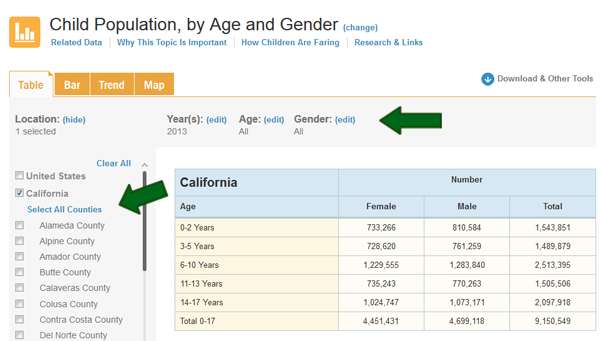
Need to customize your tables, charts and maps by location, year, age, ethnicity or other category?
All locations now are listed next to each graph, so you can immediately select the regions of interest to you. Options for changing the years, demographic groups, etc. also are located right above every graph, so it’s quick and easy to tailor your data display to meet your needs.
Want to view your data in various formats?
All of our data charting and mapping tools have been significantly enhanced. Click on the images below to check them out:
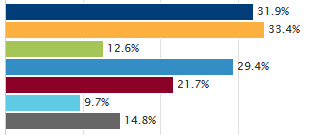
Bar Graphs:
Trend Graphs:
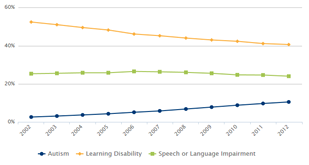
Maps:
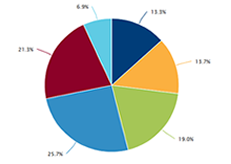
Pie Graphs:
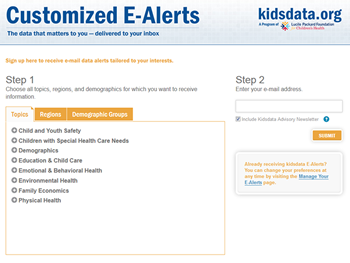
Would you like to receive occasional updates on data that interests you?
Sign up here for our customized E-Alerts.
Interested in being notified about occasional webinars on how to make the most out of the new kidsdata.org?
Send us an email and we’ll add your name to the list.
Have other questions or want to provide feedback about the new kidsdata.org?
Post a question on our “Ask a Data Question” page, contact us at [email protected], or see our Help page.
Posted by kidsdata.org
Post Comment
Bullying Prevention Month: Kidsdata.org Sheds Light on Bullying Data in California

October is Bullying Prevention Month, a time to remember that everyone can have a voice in raising awareness of bullying. Bullying Prevention Month was launched in 2006 by the PACER Center for children with disabilities, to encourage individuals to take an active role in the bullying prevention movement.
Bullying and harassment can have both short- and long-term effects on children and youth. Research shows that, in addition to the risk of physical injury, victims of bullying are at greater risk of depression, suicidal thoughts, and suicide attempts than other children and youth.
About 42% of 7th graders, 35% of 9th graders, and 28% of 11th graders in California reported being bullied or harassed at school at least once in the past year, according to 2008-10 data from kidsdata.org. Bullying and harassment at school have taken on new forms in recent years as more children and youth use social media. Recent deaths of teens in California and nationwide have prompted a national conversation on bullying, and a number of new bullying prevention efforts have emerged. In addition, federal lawmakers are considering anti-bullying legislation that would provide money to schools nationwide to improve learning conditions, increase opportunities for physical activity and nutrition education, prevent drug use and violence, and promote mental health.
When youth are bullied or harassed at school, the most common reason cited is because of race or national origin. Students who are gay, lesbian, or bisexual — or who are perceived to be – also are at particularly high risk of being bullied or harassed.
For more information about bullying in California, see these measures on kidsdata.org:
Any Reason for Bullying/Harassment, by Grade Level
by Gender and Grade Level
by Level of Connectedness to School
by Race/Ethnicity
Disability as Reason for Bullying/Harassment, by Grade Level
by Gender and Grade Level
by Level of Connectedness to School
by Race/Ethnicity
Gender as Reason for Bullying/Harassment, by Grade Level
by Gender and Grade Level
by Level of Connectedness to School
by Race/Ethnicity
Race or National Origin as Reason for Bullying/Harassment, by Grade Level
by Gender and Grade Level
by Level of Connectedness to School
by Race/Ethnicity
Religion as Reason for Bullying/Harassment, by Grade Level
by Gender and Grade Level
by Level of Connectedness to School
by Race/Ethnicity
Sexual Orientation as Reason for Bullying/Harassment, by Grade Level
by Gender and Grade Level
by Level of Connectedness to School
by Race/Ethnicity
Posted by Suny Um
Post Comment
California’s Declining Child Population: At the County Level, a Complex Shift

California’s child population is shrinking, but until now, it has been challenging to understand the complexity of how that demographic shift is playing out in the state’s 58 counties.
A new analysis by University of Southern California demographer Dowell Myers shows that the state’s population of children younger age 10 years old declined by 3.4% between 2000 and 2010. While the child population in some counties grew 20% or more, a few counties lost more than 15% of their children under age 10.
Here are the counties with the biggest declines in child population between 2000 and 2010:
Sierra (-24.5%)
Los Angeles (-16.9%)
Plumas (-15%)
Lassen (-14.1%)
San Benito (-13.4%)
Here are the top gainers in child population in the same decade:
Madera County (18.9%)
Kern County (20.6%)
Alpine County (22.8%)
Riverside County (26.2%)
Placer County (27.7%)
Why is the number of kids in a county important? As Myers suggests in a study commissioned by the Lucile Packard Foundation for Children’s Health, kids born in 2015 will bear double the economic burden of supporting the state’s economy compared to their peers born in 1985. By 2030, children are expected to comprise just 21% of California’s population, down from 33% in 1970, even as the population of aging Baby Boomers expands.
Want to learn more about child population and other demographic trends in your California county? Click here.
Related Indicators on Kidsdata.org:
Child Population
by Age and Gender
by Race/Ethnicity
by City, School District and County (65,000 Residents or More)
by City, School District and County (20,000 Residents or More)
by City, School District and County (10,000 Residents or More)
Posted by Barbara Feder Ostrov
Post Comment
New Partnership: Kidsdata.org Featured on the Chronicle of Social Change
We’re excited to partner with Fostering Media Connections (FMC), a media and advocacy group that focuses on the needs of children and youth in foster care.
FMC’s new online publication, The Chronicle of Social Change, has added a new biweekly feature highlighting data about California’s children from kidsdata.org. For example, a recent feature spotlighted California’s 27% decline in the rate of substantiated child abuse or neglect cases between 2002 and 2012.
The Chronicle of Social Change covers juvenile justice, child welfare and other fields related to youth and families.
For more information about children in California’s foster care and child welfare systems, check out these kidsdata.org indicators:
First Entries into Foster Care
by Age
by Race/Ethnicity
by Reason for Removal
by Type of Placement
Number of Children in Foster Care
by Age
by Race/Ethnicity
by Type of Placement
Length of Time from Foster Care to Adoption
Median Number of Months in Foster Care
Placement Stability, by Number of Placements
Exit Status After One Year in Foster Care
Exit Status After Four Years in Foster Care
Child Abuse and Neglect Reports
by Age
by Race/Ethnicity
by Type of Abuse
Substantiated Cases of Child Abuse and Neglect
by Age
by Race/Ethnicity
by Type of Abuse
Posted by Barbara Feder Ostrov
Post Comment
Childhood Cancer Awareness Month: California Kids and Cancer

As we mark Childhood Cancer Awareness Month, it’s important to remember that cancer remains the leading cause of death by disease for children under the age of 15, even as medical advances have improved cancer treatment.
It’s estimated that more than 1,100 children ages 0-14 are diagnosed with cancer each year in California. Youth ages 15-19 generally have higher rates of cancer diagnoses than children up to 14.
White children tend to have the highest rate of cancer diagnoses among all ethnic groups with available data, but they also have higher survival rates than African American, American Indian/Alaska Native, Asian/Pacific Islander, and Latino children once diagnosed.
Fortunately, most children diagnosed with cancer survive into adulthood. In particular, rates of survival for acute lymphoblastic leukemia, the most common childhood cancer, improved between 1990 and 2005.
For more information about cancer in California children, see these measures on kidsdata.org:
Net Five-Year Cancer Survival Rate, by Type of Cancer
Posted by Amy Lam
Post Comment
Foundation-Funded Journalism: New Series Investigates Air Pollution’s Surprising Effects on Kids
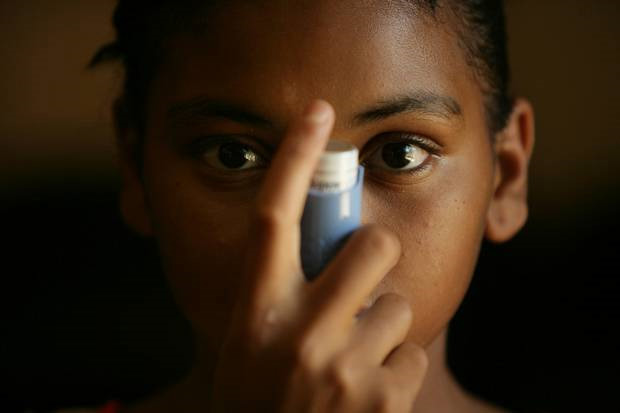
Children breathe more air per pound of body weight than adults.
That’s just one of the eye-opening facts in a new Riverside Press-Enterprise series on air pollution and its effects on health in Southern California’s heavily industrialized Inland Empire.
This in-depth series of articles, photos, videos and interactive graphics was supported by a grant from the Lucile Packard Foundation for Children’s Health Journalism Fund, awarded by The California Endowment Health Journalism Fellowships at the USC Annenberg School of Journalism.
In the series, reporter David Danelski examines how the region’s air pollution, among the nation’s worst, harms children’s health and development:
The science documenting the harm of air pollution is vast.
It’s not just lungs that are affected. Like a Trojan horse, pollution carried inside the body in the simple, constant and necessary act of breathing is penetrating natural defenses and triggering an array of consequences.
In children, pollution can sabotage the biochemistry vital to the development of growing organs. In the womb, pollution is a suspected factor in miscarriage, birth defects and autism. And in a child’s formative years, breathing difficulties can develop and other diseases may take root in the brain and elsewhere.
Learning deficits have been found in children living in polluted areas. And new research finds that pregnant women exposed to certain pollution are more likely to have children who become obese, a condition with its own disease complications.
Children hurt by air pollution can face chronic illnesses, such as asthma, and a shorter lifespan than their own genes might have predicted.
For more information on air quality in your California county, check out these kidsdata.org indicators:
Air Quality: Days with Ozone Levels Above Regulatory Standard
Air Quality: Annual Average Particulate Matter Concentration
PHOTO: Credit: Stan Lim, Riverside Press-Enterprise
Posted by Barbara Feder Ostrov
1 Comment
A Troubling Side of Going Back to School
A troubling side of going back to school is reflected in a recent San Jose Mercury News story that highlighted bullying and school safety data from kidsdata.org.
The story noted that nearly 40% of surveyed seventh-graders in Santa Clara County and nearly half in San Mateo County said they had been bullied in the past 12 months at school. Nearly 6% of seventh-graders in Santa Clara County said they belong to a gang.
But there are also positive developments as California kids head back to school this month: Low-income kids are making greater strides in math and reading proficiency in recent years. Here’s how they’re doing on 3rd grade reading tests and the High School Exit Exam math test. In addition, a greater percentage of high school students are completing college prep classes.
Check out more school-related indicators of children’s health and well being:
School Health Centers
Kindergarteners with All Required Immunizations
Students Who Are at a Healthy Weight or Underweight, by Grade Level
Bullying and Harassment at School
Pupil Support Service Personnel (nurses, counselors, and others)
Truancy, Suspensions & Expulsions
Student Eligibility to Receive Free or Reduced Price School Meals
Homeless Public School Students (California Only)
Posted by Barbara Feder Ostrov
Post Comment
New Study Shows Even Moderate Lead Poisoning’s Lasting Impact on Children

Research has long shown that children exposed to lead in the environment are more likely to display impulsive behavior, short attention spans and lower intelligence than non-exposed kids.
Now, a new study on lead poisoning shows that children with even moderate levels of lead exposure by age 3 are suspended from school by the time they reach age 10 far more often than their peers with lower blood-lead levels.
The researchers studied children whose blood-lead levels were between 10 and 20 micrograms and compared them with children whose levels were below 5. Most research has focused on children with levels above 20 micrograms, considered acute lead poisoning.
Lead contamination has declined as a children’s health problem in California and nationwide. But public health officials remain concerned because federal funding for state and local lead poisoning prevention was virtually eliminated in 2012, even as the CDC lowered the threshold at which children under 6 are considered at risk for lead poisoning. A recent report (PDF) from the National Center for Healthy Housing outlines the consequences of the federal funding cuts.
In California, nearly 2,300 children were found to have elevated blood lead levels in 2010. Want to know more about your county? Click here.
Related:
Children/Youth with Elevated Blood Lead Levels, by Age
Kidsdata.org
State and Local Childhood Lead Poisoning Prevention Programs: The Impact of Federal Public Health Funding Cuts (PDF)
National Center for Healthy Housing, July 2013
Lead Poisoning’s Impact: Kids Suspended More At School
USA Today, 8/14/13
Childhood Lead Poisoning Prevention Branch
California Department of Public Health
Posted by Barbara Feder Ostrov
Post Comment
National Immunization Awareness Month
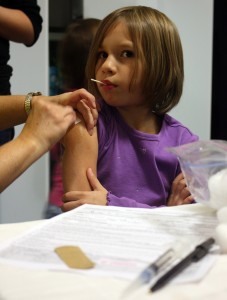
August is National Immunization Awareness Month. As the school year approaches, it’s a good reminder that vaccines are one of the best ways to keep kids healthy.
August has been named “National Immunization Awareness Month” by the Centers for Disease Control and Prevention (CDC) to remind families to take advantage of one of the most successful and cost-effective preventive health care interventions for children.
In California, about 91% of kindergarteners have all of the required immunizations, just shy of the CDC target of 95%. County percentages range between 71.6% and 98.3%, according to the latest estimates from 2011. Schools in California require proof of recommended immunizations as a condition of entry into kindergarten and licensed child care, which means that a majority of kids are vaccinated by the time they start school. However, vaccination rates are much lower for infants and toddlers, who are especially vulnerable to communicable diseases.
The CDC notes that many teenagers are missing out on key vaccines. Only about 50% of teenage girls in the U.S. have received one of three Human Papillomavirus (HPV) shots, and less than a third received the full three-shot series. This vaccine protects against four strains of HPV, one of the most common sexually transmitted diseases in the country, which account for 70% of all cervical cancer as well as 90% of genital warts.
Although vaccination rates in the United States are relatively high, some families opt out because of religious or ethical beliefs, or due to concerns about vaccine safety or effectiveness. Research shows that communities with unvaccinated and under-vaccinated populations are at higher risk for outbreaks of preventable diseases, such as measles and whooping cough. The CDC urges citizens of all ages to keep up to date with the appropriate vaccinations.
Useful Links
- Immunization Data – California
- CDC: Vaccines & Immunizations
- CDC: National Immunization Awareness Month
Posted by Amy Lam
Post Comment