

WEBINAR: Using Student Homelessness Data to Advocate on Behalf of Children and Families

Tuesday, November 18, 2014
10 a.m. to 11 a.m. PST
If you work on behalf of children and families who are homeless or are at risk of becoming homeless, this one-hour webinar is for you.
The story of California’s homeless students is largely a hidden one—many are doubled up with family and friends, while others live in shelters.
New data, however, show the extent of homelessness of California’s pre-K-12 students enrolled in public schools. Nearly 270,000 public school students in the state were homeless at some point in the 2012-2013 school year. That equates to about 4% of all California’s public school students, double the national average. The data, from the California Homeless Youth Project and available only on kidsdata.org, are sorted by county, school district and legislative district. The data include information by grade level and nighttime residence.
In this webinar, you’ll learn more about this important new dataset and how to use it in your work.
Who should participate:
Anyone who works on children’s issues related to poverty and homelessness: legislative staffers, grant writers, educators, advocates, policy analysts, health providers, consultants, communications professionals and others.
Presenters:
Shahera Hyatt, MSW, Project Director, California Homeless Youth Project
Patricia Julianelle, JD, Director of State Projects and Legal Affairs, National Association for the Education of Homeless Children and Youth
Regan Foust, PhD, Data Manager, Lucile Packard Foundation for Children’s Health
Brenda Dowdy, Homeless Education Program Specialist, San Bernardino County Superintendent of Schools
Can’t attend? Don’t worry! The session will be recorded and posted on the foundation’s website after the webinar.
Questions? Email [email protected].
RELATED CONTENT
See the data:
Learn more about the scope of student homelessness:
Issue Brief: California’s Homeless Students: A Growing Population (PDF)
California Homeless Youth Project
Posted by Barbara Feder Ostrov
Post Comment
New Study of California’s Latino Children Finds Striking Differences in Health and Well-being Within This 4.7 Million-and-Growing Population
Downloads
Full Report
Press Release
Press Release (Spanish)
A comprehensive new study of California’s Latino children paints a complex picture of their health and well-being—and finds striking differences within a 4.7 million-strong population that comprises more than half of all the children in the state.
More than 94% of these children were born in the United States. And while many Latino children live in poverty, are uninsured and have higher rates of obesity than their white counterparts, Latino children have comparable access to preventive health care and most of their parents report them as being in “good” or “excellent” health.
However, the researchers also found that children living in “linguistically isolated” families, where Spanish is primarily spoken, face far greater challenges in health access and educational achievement compared to children in families where both English and Spanish are spoken.
The study was conducted by researchers from the university-based Child and Adolescent Health Measurement Initiative and commissioned by the Lucile Packard Foundation for Children’s Health. The researchers examined data on physical health, as well as on family, school and neighborhood environments, to create a picture of the current status of Latino children in the state.
The study is intended to provide data for policymakers and advocates working both to improve the current health and well-being of Latino children and to ensure a healthy future population for California.
“Health is such a critical component of future success for California’s Latino children. If they don’t achieve their full potential, it will be a terrible economic burden for the state,” said Dr. Fernando Mendoza, professor of pediatrics at the Lucile Packard Children’s Hospital Stanford and one of the health experts consulted for the study. “This study shows the need to develop policies that improve access to health care, address language and cultural barriers to better health, and ameliorate the harmful health effects caused by poverty.”
The California findings are largely consistent with those of a recently released national study of Latino children, which noted lower rates of health insurance among Latino children compared to white children and raised concerns about persistent health disparities, but also highlighted solid gains in educational achievement.
Related Content:
Posted by Barbara Feder Ostrov
Post Comment
Quick Survey: Help Us Improve Kidsdata.org!

Kidsdata.org users, we need your help!
Please take this very quick survey about how you use kidsdata.
We’re interested in your ideas on how to make the site an even more useful resource, and we especially would like to know how you’ve used kidsdata to improve the lives of children and families. Your example could be featured in our Data in Action section or in a future blog post.
Thank you for your help.
Posted by Barbara Feder Ostrov
Post Comment
Only on Kidsdata.org: New Data on California’s Homeless Students
 The story of California’s homeless students is largely a hidden one—many are doubled up with family and friends, while others live in shelters.
New data available for the first time, however, show the extent of homelessness of California’s pre-K-12 students enrolled in public schools.
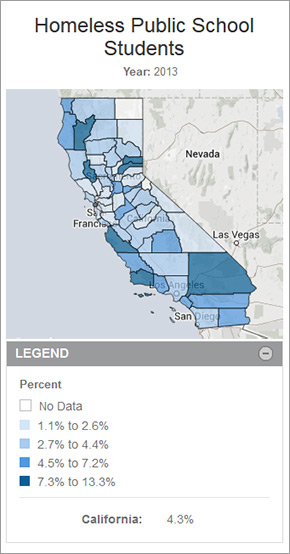
Nearly 270,000 public school students in Calif. were homeless at some point in the 2012-2013 school year. That equates to about 4% of all California’s public school students, double the national average. California accounted for just over one-fifth of all homeless public school students in the U.S. that school year.
The data released today come from a partnership between the California Homeless Youth Project and kidsdata.org. The data are sorted by county, school district and legislative district and are available only on kidsdata.org.
See the data:
Homeless Public School Students
Learn more about the scope of student homelessness:
Issue Brief: California’s Homeless Students: A Growing Population (PDF)
California Homeless Youth Project
FAQ: Frequently Asked Questions about California’s Homeless Students (PDF)
Press Release: California’s Homeless Students: Nearly 270,000 and Growing (PDF)
Posted by kidsdata.org
Post Comment
Using Kidsdata.org in Education: California Schools Magazine
Kidsdata.org can be a boon for school boards and administrators navigating the complexities of Local Control Formula Funding, according to an article in the latest issue of California Schools magazine, published by the California School Boards Association.
For comprehensive data that can help officials to make sound decisions for schools’ Local Control and Accountability Plans (LCAPs), writer Scott LaFee directs them to kidsdata.org and quotes noted technologist Clifford Stoll:
“The beauty of kidsdata, aside from the fact that it’s free, is how deeply it goes. You can look at subjects at the state, regional, county and district level. You can compare your district with others or with state averages. And the information is really quite involved. It includes factors like health, ethnicity and socioeconomics.”
You can read the article here.
RELATED CONTENT:
School Nurses: Still in Short Supply, But Earning Their Keep
In California’s Immigrant Families, Reading or Sharing Books with Children Less Common
ARCHIVED WEBINAR: The New Kidsdata.org: Putting Data to Work for California Children
Data in Your Pocket: Kidsdata.org Goes Mobile
Posted by Barbara Feder Ostrov
Post Comment
National Immunization Awareness Month: Data and Resources from Kidsdata.org

Photo credit: Quinn Dombrowski via Flickr
California’s recent whooping cough epidemic (PDF) has added new resonance to nationwide public health campaigns for this August’s National Immunization Awareness Month.
Researchers have linked parents’ vaccine refusals to a higher risk of whooping cough in their children. In California, nearly 15,000 kindergartners were exempted from required school vaccinations in 2014 because of their parents’ personal beliefs, and the percentage of kindergartners with “personal belief exemptions” is on the rise.
In 2014, 90.2% of California kindergartners had all required immunizations before entering school, but percentages vary widely among counties.
Read on for the latest California immunization data from kidsdata.org and resources for observing National Immunization Awareness Month.
Data
This map shows kindergarten immunization levels in California:
To see a similar map for immunization exemptions, click here.
See more immunization data by county>>
Resources
National Immunization Awareness Month Toolkit, National Public Health Information Coalition
National Immunization Awareness Month Resources, American Academy of Pediatrics
National Immunization Awareness Month Resources, U.S. Centers for Disease Control and Prevention
California Immunization Coalition
Childhood Immunization: Medline Plus, U.S. National Library of Medicine, National Institutes of Health
Vaccines.gov, U. S. Department of Health and Human Services
Posted by Gabby Mujal
Post Comment
ARCHIVED WEBINAR: How to Put Legislative District Data to Work For California Children
If you missed our July webinar on using legislative district data to work on behalf of children, the recording is now available!
The webinar covers how to access data available by legislative district and overlay legislative district maps on many other indicators of child health and well-being available by county, city or school district. To see a list of all kidsdata.org indicators available by legislative district, click here.
Questions? Email us at [email protected]. To sign up for announcements of upcoming webinars, data alerts and other news from kidsdata.org, click here.
RELATED CONTENT:
Tracking Children’s Health and Well-Being in California’s Legislative Districts
ARCHIVED WEBINAR: The New Kidsdata.org: Putting Data to Work for California Children
Posted by Barbara Feder Ostrov
Post Comment
Tracking Children’s Health and Well-Being in California’s Legislative Districts
Did you know that kidsdata.org gives you the ability to view data by California state and national legislative districts, and to overlay legislative maps on indicators of child health and well-being that are not available by legislative district?
Our July 15 webinar, How To Put Legislative District Data To Work For California Children, covers how to get the most out of these features. We’ll post a recording of the webinar shortly. In the meantime, here’s a “cheat sheet” of kidsdata.org indicators available by legislative district.
Demographics
Child Population, by Legislative District
Demographics of Children with Special Needs
Children with Major Disabilities, by Legislative District
Percentage of Insured/Uninsured Children Who Have Major Disabilities, by Legislative District
Family Structure
Children in the Care of Grandparents, by Legislative District
Family Structure for Children in Households, by Legislative District
Family Structure for Children in Households, by Legislative District and Race/Ethnicity
Households with and without Children, by Legislative District
Immigrants
Children Living in Linguistically Isolated Households, by Legislative District
Foreign-Born Population (Regions of 10,000 Residents or More), by Legislative District
Early Education and Child Care
Children Ages 3-5 Not Enrolled in Preschool or Kindergarten, by Legislative District
Disconnected Youth
Teens Not in School and Not Working, by Legislative District
Family Income and Poverty
Children in Poverty (Regions of 10,000 Residents or More), by Legislative District
Children Living in Low-Income Working Families, by Legislative District
Median Family Income, by Legislative District
Housing Affordability
Children Living in Crowded Households, by Legislative District
Households with a High Housing Cost Burden, by Legislative District
Unemployment
Children Without Secure Parental Employment, by Legislative District
Health Care
Health Insurance Coverage (Regions of 10,000 Residents or More), by Legislative District
RELATED CONTENT:
The New Kidsdata: Using Legislative Maps
ARCHIVED WEBINAR: The New Kidsdata.org: Putting Data to Work for California Children
Data in Your Pocket: Kidsdata.org Goes Mobile
Posted by kidsdata.org
Post Comment
Webinar: How To Put Legislative District Data To Work For California Children

Tuesday, July 15, 2014 10:00 AM – 11:00 AM PDT
If you work for, or regularly connect with, state or federal lawmakers on behalf of California children, this 1-hour webinar is for you. See archived webinar here.
Kidsdata.org is a free website that tracks more than 500 measures of child health and well-being, covering every legislative district, county, city and school district in California. It’s one of the few child-focused data sites that make data available by state and federal legislative districts. The site is operated by the nonpartisan Lucile Packard Foundation for Children’s Health.
In this webinar, you’ll learn how to use kidsdata.org to:
* Access data available by legislative district
* Overlay legislative maps on many indicators of child health and well-being
* Find the data you need, by topic, region or demographic group
* Customize visualizations to meet your needs
* Download data for analysis
* Communicate your data and findings in reports, presentations, proposals, social media and more
After a recent redesign, kidsdata.org has many new features — so, even if you’re an experienced user, you’ll want to attend this 1-hour webinar.
Who should participate:
Anyone who interacts with the California legislature or federal lawmakers and is interested in children’s issues: legislative staffers, grant writers, educators, advocates, policy analysts, health providers, consultants, communications professionals and others.
Presenter: Regan Foust, Ph.D., Data Manager, Lucile Packard Foundation for Children’s Health
Can’t attend? Don’t worry! The session will be recorded and posted on the foundation’s website after the webinar.
Questions? Email [email protected].
RELATED CONTENT:
Tracking Children’s Health and Well-Being in California’s Legislative Districts
ARCHIVED WEBINAR: The New Kidsdata.org: Putting Data to Work for California Children
Data in Your Pocket: Kidsdata.org Goes Mobile
Posted by kidsdata.org
Post Comment
In California’s Immigrant Families, Reading or Sharing Books with Children Less Common
A new Stanford study suggests that immigrant parents may not read to or share books with their young children as often as non-immigrant parents, prompting concerns about those children’s school readiness.
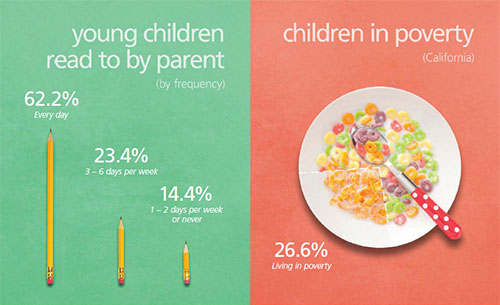
Hispanic or Asian immigrant families in California were less likely to read or look at picture books with their young children than native-born parents, regardless of income or educational status, Stanford University School of Medicine researchers found in the study, published in the journal Pediatrics. The researchers used California Health Interview Survey data from 2005, 2007 and 2009. Across ethnicities, 57.5% of parents in immigrant families reported daily book sharing or reading, compared with about 75.8% of native-born parents.
Researchers have long known that parents in low-income or limited-English households are less likely to read books with their children in early childhood. These children are more likely to enter school with language and pre-literacy skill delays compared to their peers.
The issue is particularly important in California, where about half of children live with one or more foreign-born parents and about 12% of children live in in linguistically-isolated households.
Kidsdata.org offers demographic indicators relating to children, immigration status and reading at the state, county and, in some cases, school district level:
Young Children Whose Parents Read Books With Them, by Frequency
Children Living with Foreign-Born Parents
Third Grade Students Scoring Proficient or Higher on English Language Arts CST
photo credit: John Mick via Flickr
Posted by kidsdata.org
Post Comment