Posts Tagged ‘Data Projects’
Organizations Statewide Win Grants to Use Data to Promote Children’s Health
Last fall, kidsdata.org launched a pilot program to offer grants to organizations statewide that want to make better use of children’s data in their work. Our goal: To encourage creative strategies for using data to bring attention to key issues facing children, and to promote the use of data in efforts to improve children’s lives.
Interest was strong; we received dozens of worthy proposals from across the state. We ultimately chose 14 proposals, all of which are for approximately $10,000. The grants will be used for a range of purposes, including data analysis and development, training and education, and public information campaigns. Much of the data to be used in the projects will come from kidsdata.org, and the grants will serve children across the state, from Shasta County to Stockton to San Diego. See the full list of grantees >>
As we begin to see results from these grants over the next year, we’ll showcase the projects on kidsdata.org and through this blog. And while this program is a pilot, we encourage you to sign up to be notified of any future kidsdata.org grant opportunities.
Posted by kidsdata.org
Tags: Data Projects, News About Kidsdata.org
Make Your Case with Compelling Facts
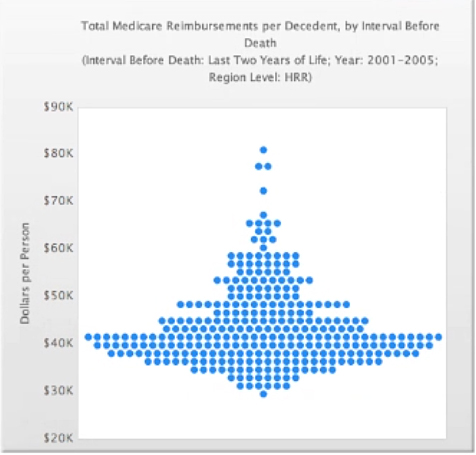 |
This “turnip” or “space invader” graph was one of the data visualizations highlighted in the session. |
Recently, I had the pleasure of moderating a session about data at the Nonprofit Technology Conference in Washington, D.C. This annual conference explores trends in technology that affect nonprofit work, and this session focused on making your case with compelling facts.
Given that the audience for this conference is exclusively nonprofits, we knew that every attendee needs data — whether they want it or not. All kinds of nonprofit work — advocacy, grantseeking, and even reporting to a board of directors — require data. But, that doesn’t have to mean run-of-the-mill excel graphs or, even worse, text-heavy pdfs. There are so many intriguing and, in some cases, inexpensive, ways to tell your story through data. Here are some that we featured in the session:
Two of our expert panelists came from Velir Studios, the web firm behind kidsdata.org and many other data sites, such as KidsCount, Kaiser State Health Facts, and the Dartmouth Atlas of Health Care. See the video of their presentation, which includes mapping examples and many other data visualizations.
Perhaps the biggest question of the day was: how can I do this for free/on-the-cheap? Several Google tools were mentioned as low-cost and easy-to-understand data displays. Google Chart Tools offers a wizard for creating several types of dynamic data displays, and Google’s Public Data Explorer allows you to upload your own data, create your own visualizations, and then share what you’ve done with the masses.
Other free, inexpensive, or at least easy-to-use tools that were noted included Tableau Public (there’s also a server edition for more sophisticated developers); Socrata, which can help you offer your data publicly; and mapping tools such as GeoCommons, and IndieMapper. Additional resources are included in this handout from the session.
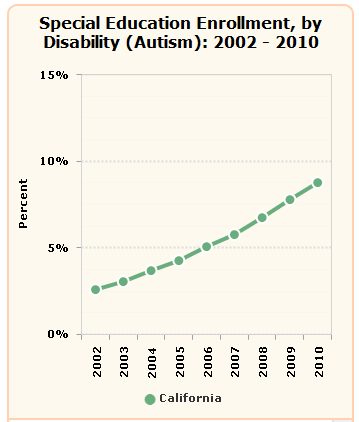 And, of course, no data session would be complete without some display examples from kidsdata.org. Andy Krackov, our Assistant Vice President of Programs & Partnerships, pointed out some tips for communicating data, noting that kidsdata.org makes it easy to monitor trends, like the graph on the left, and identify disparities.
In addition to these data visualization examples, the session included in-depth discussions about several related topics:
- How data and personal stories can come together to make your case even more compelling. See a blog post on this topic by session panelist Kurt Voelker from Forum One Communications.
- How to find data within your organization that others may be interested in (it can be anywhere — grant reports, web analytics, etc.) and, once you’ve found it, whether or not you should release it. (You should err on the side of releasing it.)
- If you have a mountain of data, how you can decipher what’s important. (Focus on your mission.)
- How to use data in your story, but still keep your story interesting
The discussion continues on Twitter via the hashtag #11ntcdata. Feel free to post questions there or here. And, if you know of other compelling data visualizations not listed here, or other free tools and resources, please let us know.
Posted by Felicity Simmons
Tags: Data Challenges, Data Projects
East Bay Studies Reveal Health Disparities
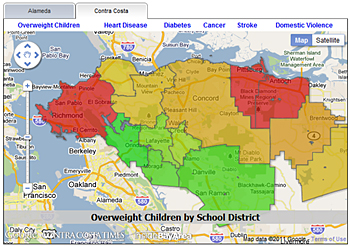
Data released this month from local East Bay studies show wide disparities in several areas of health — and a subsequent impact on life expectancy.
A few key findings, from a series in the Contra Costa Times on these studies:
- In Alameda County, the life expectancy for an Asian American girl is 20 years longer than that of an African American boy.
- In Contra Costa County, children born into low-income communities have a life expectancy of 75 years, compared to 82 years in higher-income areas.
The studies, which considered both adult and child health, also looked at specific health issues such as obesity, asthma, and cancer. Detailed maps show obesity rates — as high as 41% in one school district in Alameda County — and rates of childhood asthma, available by city. These data showed significant disparities between cities in hospitalization rates for childhood asthma, from 800.7 per 100, 000 children in Oakland, to 118.4 per 100,000 in Pleasanton.
The studies were funded by the Hospital Council of Northern and Central California, and aim to help hospitals analyze and address local health needs. County officials say they’ll also use the data to focus their attention and resources on key issues and demographic groups.
If you don’t live in the East Bay – or even if you do – kidsdata.org offers data on cancer rates, asthma hospitalizations, weight, and many other issues for your community.
Kudos to the hospital council and Contra Costa and Alameda counties for generating and using such a rich data set. Such local data are invaluable for raising the visibility of serious child health issues in our communities.
Posted by kidsdata.org
Tags: Child Health Initiatives, Data Projects
Poverty Linked to Wide Array of Child Health Issues, Parent Survey Shows
 Newly updated data reveal that the percentage of California public school students eligible for free/reduced price meals rose from 51% in ’08 to 56% in ’10 — an increase of more than 281,000 children statewide. Eligibility for this program is widely viewed as a proxy measure for poverty.
As increasing numbers of children fall below the income level required to qualify for the program, it’s instructive to note data from our foundation’s 2010 California Parent Survey. The survey asked parents of 1,685 children how their child was faring across dozens of measures that address the whole terrain of childhood, from physical, emotional and behavioral health to school-related issues and family and societal influences. Parents’ responses highlight the many ways that poverty is connected to child health.
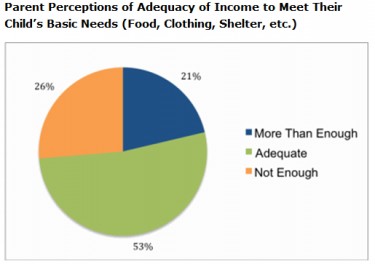
The parents of one-quarter of children said their family’s income was not adequate to meet their child’s basic needs, such as food, clothing, and shelter. The survey also showed that lower-income children have poorer health; lower quality health care; poorer emotional health; higher rates of depression; neighborhoods that are less safe; lower-quality schools, and less satisfactory child care arrangements (differences were statistically significant.)
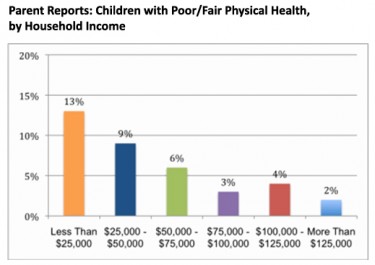 These results conform with a substantial body of research that links poverty with long-term negative consequences for children. According to a 2009 Child Trends analysis of 10 studies, poor children are more likely than children from more affluent families to have low academic achievement, to drop out of school, and to have health, behavioral, and emotional problems. As the Child Trends report notes, “these linkages are particularly strong for children whose families experience deep poverty, who are poor during early childhood, and who are trapped in poverty for a long time.”
For policy implications related to child poverty, see the Child Trends report.
Posted by kidsdata.org
Tags: Data Projects, New Data
SacBee Op-Ed: Student-Level Data Are Needed
We recently came across this opinion piece from the Sacramento Bee and, given its data focus, thought it might be of interest.
Written by former state legislator Dede Alpert and former state superintendent of public instruction Jack O’Connell, the article outlines the need for a tool to measure student progress over time. While California has such a system — the California Longitudinal Pupil Achievement Data System (CALPADS) — funding has been cut to support it.
In encouraging the state Legislature to restore funding for the system, Alpert and O’Connell note the following:
“Now more than ever, accurate student information is needed for sound decision-making, transparency, accountability and good stewardship of taxpayer dollars.
Read the entire article, as well as comments supporting and opposing the system, here.
Posted by kidsdata.org
Tags: Data Challenges, Data Projects
2010 Children Now Report Card Sets Agenda
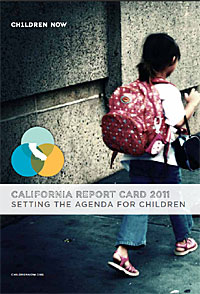 Every year, Children Now offers a Report Card to grade key areas of child well being in California. This year, the advocacy organization has taken this tool a step further by offering a children’s health agenda to incoming lawmakers.
The agenda addresses and recommends action on several key issues, including:
- Strengthening California’s afterschool infrastructure
- Establishing a comprehensive, longitudinal data system to track educational outcomes
- Coordinating and streamlining the state’s delivery of children’s services
- Providing quality health coverage and improving access to care
Overall, the state received an average grade of C- in the report card, with grades ranging from a D for oral health services and K-12 education, to a B+ for afterschool programming. The report cites disproportional budget cuts to children’s programs as the reason for consistently low grades.
Posted by kidsdata.org
Tags: Data Projects
Now Available on Kidsdata: More Data About Kids with Special Needs
 |
| View a slideshow of data highlights from Children with Special Health Care Needs: A Profile of Key Issues in California |
Kidsdata.org has just added wide-ranging data — dozens of measures in all — on the approximately 1.4 million children in California who have a special health care need.
These new indicators are drawn in part from a just released study which found that California ranks at or near the bottom compared to other states on multiple measures of how well these children are faring. The report, Children with Special Health Care Needs: A Profile of Key Issues in California, was commissioned by our foundation and prepared by the Child and Adolescent Health Measurement Initiative.
On kidsdata.org, we now offer more than 80 measures of the health and well being of children with special health care needs at the state level with a U.S. comparison. These data include:
And some data related to children with special needs are available at a local level:
In an effort to bring together those working on issues affecting children with special health care needs, the foundation is establishing the California Collaborative for Children with Special Health Care Needs. The goal of the collaborative is to create a shared agenda and advocate for meaningful and lasting system change — including improving over the long-term measures of how these children are faring. Sign up to be a part of this work >>
Posted by kidsdata.org
Tags: Data Projects, Data Sources, New Data
‘Distress Index’ Measures Recession’s Impact on Local Families
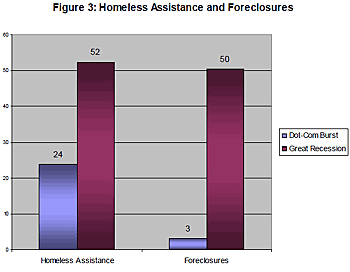 Just how bad is this recession — and how is it affecting families in high cost-of-living areas like the Bay Area? A new ‘Distress Index’ can shed some light.
The Stanford Center for the Study of Poverty and Inequality, in partnership with New America Media and the San Francisco Foundation, just released “Measuring Economic Distress in San Francisco,” an index that monitors 11 indicators of distress, including bankruptcies, CalWORKs enrollments, foreclosures, unemployment, food bank pantry visits, and other measures where data are updated more frequently than on an annual basis.
The index assesses San Francisco’s distress for the last 10 years — primarily comparing the dot-com bust to the recent recession. Although the index is limited to the city/county of San Francisco, researchers noted that they hope other communities will replicate the idea.
Overall, researchers found that the distress index in San Francisco has been increasing since 2000. It also notes that foreclosures, food stamps applications, and homeless assistance are all higher during this recession than they were during the dot-com bust. For all results, visit http://www.stanford.edu/group/scspi/_media/pdf/cpr_papers/San_Francisco_Distress_Index.pdf
Interested in data about family economics for your community? We have several indicators on kidsdata.org.
Posted by Felicity Simmons
Tags: Data Projects
Partnership with CHKS Provides Easy Access to Depression, Bullying and Other Key Datasets
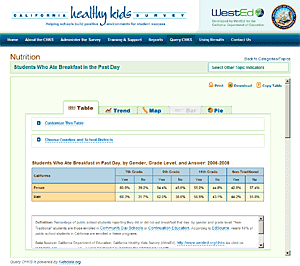 Finding timely measures of critical issues such as teenage depression, bullying, and drug use can be quite challenging. Fortunately, here in California, we have a rich database of self-reported information for these and other behavioral/emotional health topics through the California Healthy Kids Survey (CHKS). Thanks to a partnership with WestEd, which administers the survey, and the California Department of Education, kidsdata.org offers more than 80 indicators from CHKS – all available at the school district level. This month, we’re extending that partnership, with WestEd’s announcement of the launch of its new website, Query CHKS, which allows users to view and customize data from CHKS directly from WestEd’s own site.
Query CHKS combines the wealth of valuable data from the survey with the data display of kidsdata.org, allowing for easy access to the millions of data points available through CHKS. Many of the tools available on kidsdata.org now are available on Query CHKS, including the ability to view data as trend or bar graphs, maps, pie charts, and tables; as well as the options to download or copy those data.
And, as the data are updated on kidsdata.org, they will automatically be updated on QueryCHKS.
You can add a graph from kidsdata.org to your website, too. Simply find the data you’re interested in, customize the chart with your preferences, and click “embed” in the top right.
Posted by kidsdata.org
Tags: Data Projects, Data Sources, News About Kidsdata.org
Children Now Scorecard Offers ‘Fingerprint’ of Child Health Across California
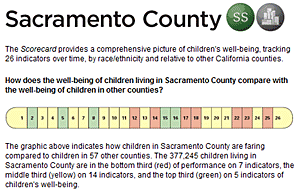 |
The scorecard offers a unique fingerprint of how children are faring in each county in California. |
Noting that no two counties are alike in California with regard to children’s health, Children Now recently released its 2010 California County Scorecard of Children’s Well-Being.
The scorecard offers a “fingerprint” for each county in California, showing each county’s performance in a range of areas of child well being, relative to other counties’ performance. Counties are organized according to rural or urban status and, within that, high- or low-income. The 26 measures in the scorecard include education, safety, substance use, connectedness to school, and many others. Data about breastfeeding and prenatal care are cited from kidsdata.org. Check out all the indicators here: http://www.childrennow.org/subsites/publications/invest/scorecard10/scorecard10_home.htm.
And, view each county’s fingerprint at http://www.childrennow.org/subsites/publications/invest/scorecard10/scorecard10_comparison.htm
Posted by Felicity Simmons
Tags: Child Health Initiatives, Data Projects, Data Sources


