

Adverse and Positive Childhood Experiences Point to Patterns of Risk and Resilience
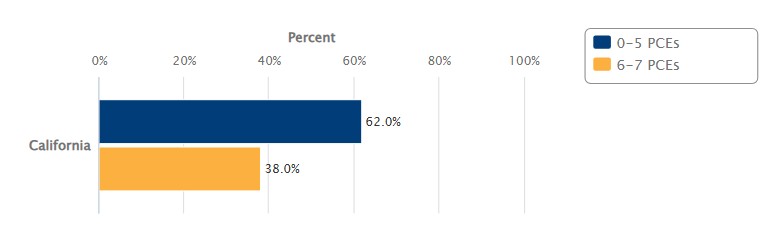
Percentage of California Adolescents Ages 12 to 17 by Number of Positive Childhood Experiences (PCEs): 2022
KidsData is excited to announce a new suite of indicators on Positive and Adverse Childhood Experiences (PACEs) in California, released in partnership with the California Department of Public Health, Injury and Violence Prevention Branch, Essentials for Childhood Initiative.
The data, drawn from the California Health Interview Survey, provide information on PACEs among teens and adults statewide, broken down by race/ethnicity, sexual orientation, income, insurance coverage, and other characteristics. Youth mental health indicators also are available by teens’ exposure to PACEs.
Estimates are available for 2021 and 2022, with youth data for 2023 and 2024 coming soon. Key findings include:
- In 2022, around 2 in 5 California youth had at least one of five
Adverse Childhood Experiences (ACEs) asked about in the survey—parent divorce or separation, parent incarceration, household domestic violence, household mental illness, or household substance abuse. - Positive Childhood Experiences (PCEs) also were common, with a similar share estimated to have at least six of the seven PCEs asked about. These youth were less likely to have ACEs than their peers with five or fewer PCEs.
- Among adults statewide in 2021, those with at least a bachelor’s degree or with annual income of at least $100,000 had lower rates of 4-8 ACEs than those with less education or income, as did heterosexual adults when compared with homosexual and bisexual adults.
Explore the data:
Youth-reported PACEs
- PCEs overall and by type, gender, income level, and race/ethnicity
- overall and by type, gender, income level, race/ethnicity, and number of PCEs
Youth-reported mental health and PACEs
- Anxiety by number of PCEs and ACEs
- Depression by number of PCEs and ACEs
- Suicidal thoughts by number of PCEs and ACEs
- PCEs and ACEs
Adult-reported PACEs
- PCEs overall and by type
- overall and by type, education level, income level, type of insurance, race/ethnicity, sexual orientation, and number of PCEs
Also, visit KidsData’s Childhood Adversity, Resilience, and Positive Experiences topic page for related measures and resources.
Funding for KidsData’s PACEs indicators from the California Health Interview Survey is provided by the California Department of Public Health under contract #24-10589.
Posted by kidsdata.org
Post Comment
What We Know—and What’s Missing—About Adverse Childhood Experiences
In recognition of Child Abuse Prevention Month, KidsData has released new estimates of adverse childhood experiences (ACEs). Maltreatment and other ACEs—such as growing up around violence, substance abuse, or mental health problems—can be traumatic, disrupt healthy development, and increase the risk of serious health problems in adulthood. The good news: ACEs are largely preventable, and data showing who’s most likely to be impacted can help focus prevention efforts.
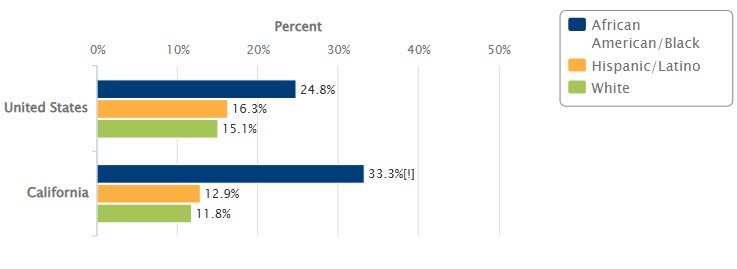
The need for targeted interventions is acute. According to estimates from the National Survey of Children’s Health (NSCH), African American/Black and Hispanic/Latino children generally face higher rates of exposure to two or more ACEs than their white peers, statewide and nationally.
Percentage of Children Ages 0 to 17 With Two or More Adverse Childhood Experiences (ACEs), by Race/Ethnicity: 2024
Among the ACEs asked about in the NSCH—but not reported in the most recent data for 2024—is being judged or treated unfairly because of sexual orientation or gender identity. Sexual and gender minority youth experience greater adversity in childhood than their straight, cisgender peers, and disparities may be even larger than research suggests, as many ACEs data sources don’t capture homophobia, transphobia, or other traumatic stressors many LGBTQ+ young people face.
Percentage of Children Ages 6 to 17 Who Have Been Treated or Judged Unfairly Because of Their Sexual Orientation or Gender Identity: 2022–2024

Despite being asked about in the 2024 NSCH, data on discrimination due to sexual orientation or gender identity are not available publicly, due to government actions to restrict access to these data. Estimates for 2022 and 2023 show discrimination of this type impacting hundreds of thousands (between 1% and 2%) of youth in California and across the U.S., even before sweeping rollbacks of LGBTQ+ protections beginning in 2025.
When data are collected but never released, an opportunity to make better decisions is lost. For evidence-based policy and program options to prevent, interrupt, and mitigate the effects of ACEs, and to ensure all young people have access to trauma-informed services tailored to their specific experiences and needs, see KidsData’s overview of policy options.
For more on federal health data and policy related to sexual orientation and gender identity, see the Federal Data Forum, State Health Access Data Assistance Center, Williams Institute, and KFF.
Opportunities
First 5 California: Stronger Starts Statewide Day of Action
On Wednesday, May 6, First 5 California will launch a new phase of its Stronger Starts campaign, focused on addressing ACEs and toxic stress in children and ensuring families have the support they need to thrive. Join the press conference and community event at 10 a.m. PT in Sacramento, or visit the Stronger Starts website to learn more about the campaign.
Association of Public Data Users (APDU) unConference
APDU’s attendee-organized “unconference” will bring together data users to share knowledge and discuss issues of concern, provide networking opportunities, and brainstorm about the future of public data. The virtual event happens July 7, with early-bird registration through May 31.
Children’s Health Resources
EpiCenter: California Injury Data Online Updates
The California Department of Public Health has updated its EpiCenter interactive tool with 2024 data on injury-related deaths, hospitalizations, and emergency department visits. Data can be queried for children and young adults specifically, by age group, sex, county, cause of injury, and other parameters.
Maternal Mental Health Screening in California: Progress and Opportunities
The UCSF Center for Health Equity presents new findings on depression and anxiety screenings during and after pregnancy in California, based on the 2020–2024 Maternal and Infant Health Assessment. The brief also outlines strategies to increase universal screening, including reducing systems barriers for both mothers and providers, and improving the transparency and quality of monitoring data.
Posted by kidsdata.org
Post Comment
For 3 in 10 California Kids, the Food They Need Is Out of Reach
KidsData has added a new indicator of children’s household food sufficiency, which measures not just whether families can afford enough to eat, but also whether they can afford the wholesome, nutritious foods needed to support healthy development and wellness for all family members.
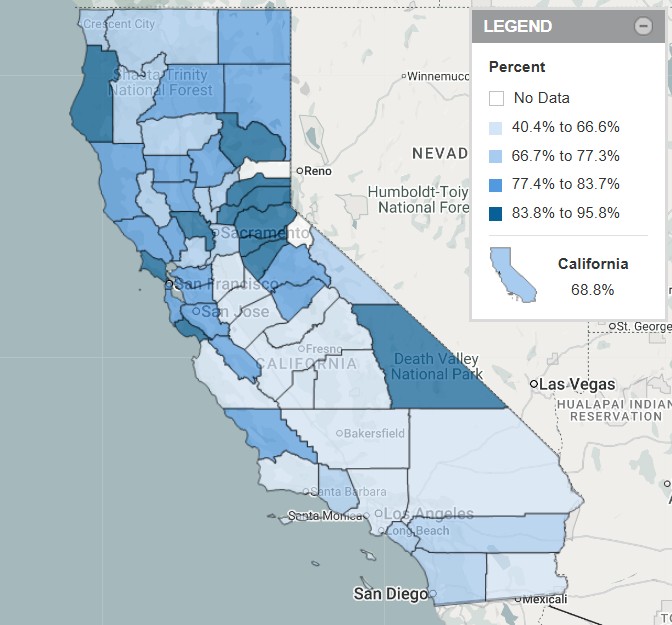
Nationwide, the latest estimates show that fewer than two-thirds of children lived in households that were fully food sufficient in the previous year—meaning they could always afford enough, good-quality food for everyone in the home. California outperformed the U.S. overall, with an estimated 69% of children living in households that could always afford both the quantity and quality of food to meet all members’ needs.
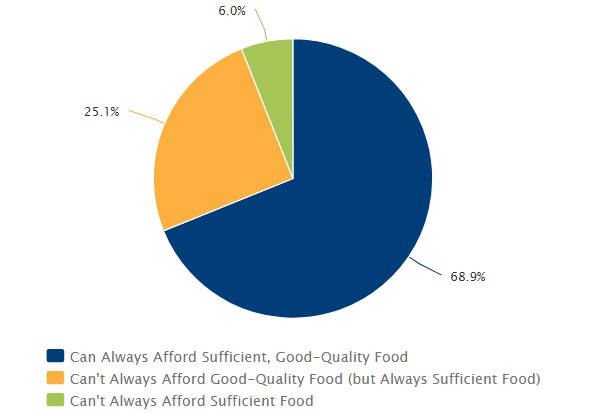
Still, this leaves more than 1 in 4 California children whose households couldn’t always afford the types of healthful foods they should eat. And combined with kids in households that couldn’t always afford enough to eat, this amounts to more than 2.5 million young people without consistent access to good, nutritious food for themselves and their families.
Visit KidsData to learn about the health impacts of uncertain access to nutritious foods and to explore program and policy options to improve food security for families.
Opportunity
Help KidsData Identify Gaps in Child Well-Being Data
The KidsData team is seeking feedback from advocates, program staff, educators, families, and other data users to better understand which populations are being overlooked in available health data—and how more detailed, disaggregated information could better reflect children’s diverse experiences across California. To participate, complete our short questionnaire or email [email protected] to schedule a brief conversation with us.
Posted by kidsdata.org
Post Comment
California’s Health Care Safety Net Catches More Than Half of All Kids—Many Could Start Falling Through
Medicaid was designed for kids. Together with the Children’s Health Insurance Program (CHIP), Medicaid pays for almost half of all births nationwide and is the largest source of health insurance for children. These programs play especially important roles in providing coverage and filling coverage gaps for young children, children in lower-income families, children and youth with special health care needs (CYSHCN), and other young people who otherwise couldn’t get the health services they need.
Children enrolled in Medicaid and CHIP—or Medi-Cal, as these programs are known in California—don’t just have better access to care than children without insurance. They also experience a host of lifelong well-being benefits—they do better in school, are more likely to finish high school and graduate college, have fewer health problems later in life, and earn higher incomes as adults.
Average Percentage of California Children and Young Adults Ages 0 to 20 Enrolled in
Medi-Cal per Month: 2024
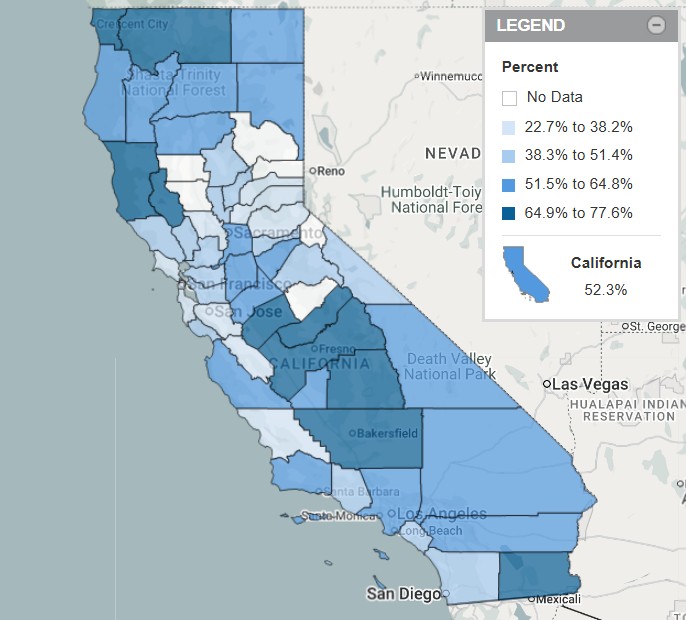
In 2024, nearly 5.5 million Californians ages 0 to 20 were enrolled in Medi-Cal on average each month—this translates to 52% of kids statewide, up from 36% in 2012. Across counties with data, average monthly enrollments ranged from more than three in four young people (Tulare, at 78%) to fewer than one in four (Placer, at 23%).
Medi-Cal is an important source of health coverage for children and youth of color in California. More than 60% of African American/Black and Hispanic/Latino youth were enrolled in Medi-Cal each month in 2024—rates more than double that of their white peers (23%).
Around a third of Medi-Cal enrollees under age 21 have a written language other than English. Spanish is the most common non-English language by a large margin (more than 1.6 million enrollees), but more than 40,000 enrollees use a Chinese language such as Cantonese or Mandarin, more than 30,000 use Vietnamese, and more than 20,000 use Russian.
Recently enacted changes to Medicaid and CHIP financing, eligibility, and access at the federal level have the potential to impact enrollments dramatically in future years, reshaping state health care systems in California and across the nation. Visit KidsData for policy and program options to protect and strengthen health care for children.
Opportunities
The Day Federal Data Went Dark: A Year of Monitoring and Action
On January 29, at 2:00 p.m. ET—one year after thousands of federal webpages began going dark—dataindex.us and the Association of Public Data Users are co-hosting a webinar on the current state of federal data. Featuring PRB alongside other data community leaders, the event will highlight tools developed to monitor public datasets and actions being taken to safeguard these essential resources.
On Wednesday, February 4, at 11:00 a.m. PT, the California School-Based Health Alliance will host a session with California Surgeon General Diana Ramos highlighting school-based efforts to reduce ACEs, strengthen PCEs, and support whole-child well-being through screenings, trauma-informed practices, and youth-centered strategies.
Children’s Health Resources
National Survey of Children’s Health (NSCH) Data Briefs
The Maternal and Child Health Bureau has released three new data briefs highlighting 2022-2023 and 2024 data from NSCH on children and youth with special health care needs, young children’s school readiness, and school-age children’s healthy behaviors.
Recent Changes in Children’s Vaccination Rates by Race and Ethnicity
An analysis by KFF finds declining vaccine coverage against measles, mumps, rubella (MMR) and influenza among U.S. children overall, along with persistent coverage gaps by race and ethnicity.
Posted by kidsdata.org
Post Comment
Food Insecurity Impacts More Than 1 in 6 Kids
In response to the U.S. Department of Agriculture’s (USDA’s) recent decision to stop collecting data on household food insecurity, KidsData is exploring alternative sources for measuring childhood food insecurity in California.
Food insecurity—when a household lacks the money or other resources to provide consistent, dependable access to enough food for everyone in the household to enjoy active, healthy lives—is a major public health problem in California and across the nation. Compared with food-secure children, children experiencing food insecurity are at higher risk for a host of health problems with potentially lifelong impacts, including acute and chronic developmental, behavioral, mental, and physical health conditions.
Percentage of California Children Ages 0 to 17 Living in Food-Insecure Households: 2023
According to the latest estimates based on federal data sources, more than one in six California children live in a household experiencing food insecurity—up from around one in eight in 2020. This translates to over 1.4 million kids—more than the total child population of Massachusetts or Missouri—in 2023. In 26 of California’s 58 counties, at least one in every five children lived in a food-insecure household.
Food assistance programs such as the Supplemental Nutrition Assistance Program (SNAP, or CalFresh in California) provide a safety net to help low-income children and their families access adequate nutrition. Participation in these programs is shown to reduce poverty and improve overall health in childhood, and is linked to positive economic and health outcomes in adulthood.
CalFresh served nearly 5.5 million Californians, including nearly 2 million children, in July 2024. Compared with 10 years earlier, CalFresh participation in 2024 was up 22% for Californians of all ages but down 16% for Californians ages 0 to 17. See KidsData for policy options to boost nutrition program access, participation, and benefits for children and families in need.
KidsData in the News
A Merced FOCUS story about obesity rates in San Joaquin Valley counties cites KidsData’s indicators of students who are overweight or obese, which are featured in the California Health Care Foundation’s 2025 California Latino Health Dashboard.
Children’s Health Resource
The Impact of Positive Childhood Experiences (PCEs) on Behavioral Health Outcomes
A new resource from the California Essentials for Childhood Initiative looks at how PCEs shape behavioral health outcomes in adulthood and describes strategies to promote positive experiences, environments, and relationships during the early years.
Posted by kidsdata.org
Post Comment
Number of California Kids at a 30-Year Low, and Projected to Continue Dropping
Demographic trends help project needs for education, child care, health care, and other services. To plan appropriate policies and programs, policymakers need to understand the size and composition of the communities they serve, how these vary by location, and how populations are changing. In California, growing numbers of retiring seniors and a shrinking child population point to workforce and taxpayer shortages in the coming decades. These population dynamics mean children are a more important resource than ever before—creating new urgency to ensure today’s children have the supports they need to reach their full potential.
Number of California Children Ages 0 to 17: 2004 to 2025
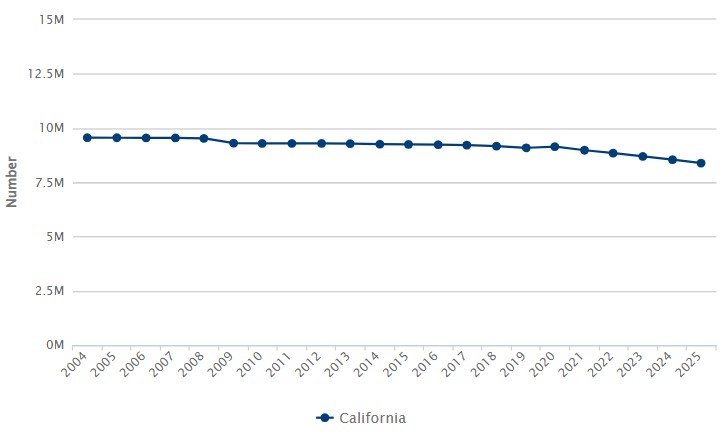
In 2004, 9,559,942 children ages 0 to 17 lived in California; today more than 1 million fewer kids (8,386,716) call the state home. In just the last five years, California’s child population has fallen by more than 760,000 and in the next five years it’s expected to fall by another 635,000. By 2060, fewer than 6.7 million children will live in California—a drop of more than 30% from the mid-2000s peak.
Compared with 1995—the first year for which comparable data are available—the number of children is down statewide and in most counties. But trends vary widely at the local level. The 10 California counties with the smallest child populations (fewer than 5,500 in 2025) have seen some of the steepest declines—all have lost at least 15% of their child population in the last 30 years, and half have lost more than 30%. Looking forward to 2060, three of these counties—Lassen, Modoc, and Mono—are projected to have less than half as many children as today.
Yet small counties are not alone—Los Angeles (the state’s largest county by far) has lost 29% of its child population since 1995 and is projected to lose 31% more by 2060.
On the other hand, some regions—particularly the Sacramento area and San Joaquin Valley—have experienced strong child population growth over the last three decades. Fresno, Kern, Kings, Madera, Merced, Placer, Sacramento, San Joaquin, Tulare, and Yuba counties all have seen their number of children grow by at least 10% between 1995 and 2025.
Among the 12 counties with the fastest growth over this period, five have a child population with a Hispanic/Latino majority above 70%. Statewide, just under half of kids (48%) are Hispanic/Latino, around one-fourth (26%) are white, 13% are Asian, 7% are multiracial, 5% are African American/Black, and less than 1% are American Indian/Alaska Native or Native Hawaiian/Pacific Islander. At the county level, estimates of the share of Hispanic/Latino children in the total child population range from 11% to 91%, while the share of white children ranges from 4% to 66%.
Society’s reliance on a decreasing number of increasingly diverse children highlights the importance of policy and program options that nurture every child. See KidsData for strategies aimed at aligning service systems with demographic trends and ensuring that adequate, culturally responsive resources are in to place to support thriving children, families, and communities.
KidsData in the News
Crisis Point: Spike in Black Youth Suicide Rates Trigger Alarm Among Advocates
A California Black Media story examining rates of suicide among young people of color statewide and nationally cites KidsData’s indicator of youth suicides by race/ethnicity.
How the Federal Government Shutdown Is Affecting the Inland Empire [subscription required]
A story published in news outlets across Southern California on the impacts of the federal government shutdown cites KidsData on Women, Infants, and Children (WIC) program participation in Riverside and San Bernardino counties.
Children’s Health Resources
Evidence-Based Youth Mentorship Programs
A new resource from the California Essentials for Childhood Initiative looks at evidence-based programs that promote mentorship and adult engagement with youth and provides information about their effectiveness.
Measuring Childhood Disability Using the National Health Interview Survey
A new analysis of data from the National Health Interview Survey estimates the percentage of U.S. children with disabilities using four distinct identification strategies. Depending on the strategy, estimates range from 11% to 23% and show differences in disability prevalence by gender, race/ethnicity, and income level.
Opportunities
California Health Interview Survey (CHIS) Data User Training
Join the UCLA Center for Health Policy Research Thursday, October 30, at 12:00 p.m. PT to learn how to access CHIS estimates for 2024 and earlier years using the AskCHIS™ and AskCHIS™ Neighborhood Edition query tools.
Submit a Comment to Save the Current Population Survey Food Security Supplement (CPS-FSS)
Through Monday, November 3, at 8:59 p.m. PT, dataindex.us is collecting perspectives and comments on the announced termination of CPS-FSS, the only nationally representative data collection on household food insecurity. Your support for CPS-FSS will be shared with state departments of agriculture, whose leaders can urge federal decision-makers to reinstate this critical dataset.
Posted by kidsdata.org
Post Comment
In-Hospital Breastfeeding Rates Remain Lopsided Across Regions, Racial/Ethnic Groups
Breastmilk is the ideal food for infants, with few exceptions. Breastfeeding is associated with a wide range of nutritional and overall health benefits—for both children and parents—that are significant, long lasting, and overwhelmingly supported by the available evidence. Leading health organizations, including the American Academy of Pediatrics (AAP) and the World Health Organization, recommend exclusive breastfeeding for the first half year of life, followed by breastfeeding with complementary table foods through at least two years. AAP also recommends that hospitals implement care practices—such as breastfeeding within the first hour of birth—that have been shown to support successful, long-term breastfeeding.
In-Hospital Breastfeeding Initiation in California: Percentage of Newborns Breastfed Exclusively After Delivery, 2022
According to the latest data, more than 2 in 3 California infants born in 2022 were breastfed exclusively before leaving the hospital after birth. Overall, this figure is up more than 10 percentage points from 2010. Following statewide trends, rates rose in all but seven counties with data over this period.
Residents of California’s Gold Country and Sierra Nevada regions recorded some of the highest rates of in-hospital exclusive breastfeeding in 2022. Amador, Calaveras, El Dorado, Nevada, Placer, and Plumas counties each saw rates at least 15 percentage points above the state average. By contrast, rates across the San Joaquin Valley were below the statewide level.
The share of white newborns exclusively breastfed in the hospital (81% in 2020-2022) is consistently higher than for other racial/ethnic groups in California. Since 2010, only American Indian/Alaska Native newborns have been within 10 percentage points (72% in 2020-2022) of their white peers, while the gap for African American/black newborns (61% in 2020-2022) has typically been at least twice as large. Across counties with data for 2020-2022, 39 recorded exclusive breastfeeding rates above 80% for white newborns; only seven recorded such rates for Hispanic/Latino newborns.
Visit KidsData to explore policy and practice options to address disparities in breastfeeding initiation and to improve overall breastfeeding rates in the hospital, workplace, and community. Also see KidsData for data on infants who receive any breastmilk during their hospitalization, and the Maternal and Infant Health Assessment for indicators of breastfeeding intention, duration, and more.
Children’s Health Resource
The Health of California: A Regional Perspective
The UCLA Center for Health Policy Research has released a series of reports highlighting key health differences and similarities across seven distinct California regions. Using California Health Interview Survey data broken down by race/ethnicity, income level, and citizenship status, the reports examine topics such as health insurance coverage, access to care, chronic conditions, food insecurity, and housing instability in California communities.
Opportunity
California’s Changing Child Care Landscape: Understanding Costs and Supply
A new report by the Public Policy Institute of California assesses the shifting landscape of publicly supported child care for children ages 5 and younger in California, and explores whether the cost of care is affordable for families and sustainable for providers. Join the report authors Thursday, September 4, at 11:00 a.m. PT for a discussion of their findings and a Q&A session.
Recently Released Data
We recently released data about breastfeeding, health care, and intimate partner violence. See links to the latest here.
Posted by kidsdata.org
Post Comment
Spotlight on Children With Special Health Care Needs (Part 5): 10 Ways Health Conditions Impact Kids and Families
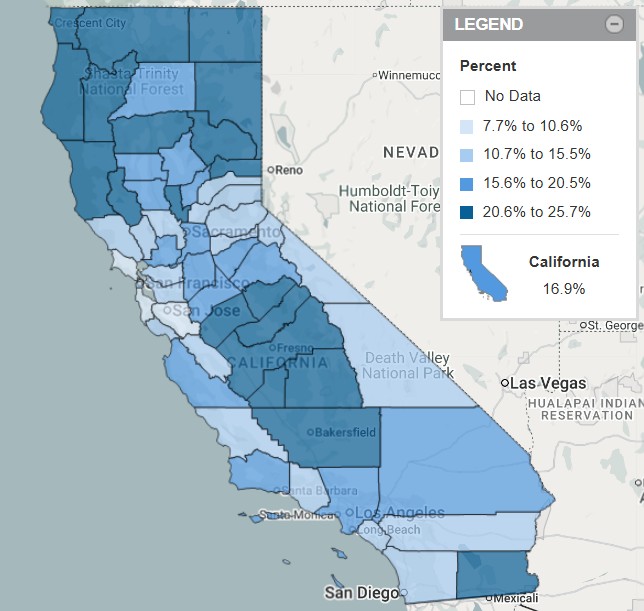
Percentage of Children With Special Health Care Needs Ages 0 to 17 Whose Conditions Affected Their Daily Activities in the Previous Year: 2023
This final installment in our series on children with special health care needs (CSHCN) describes medical, financial, educational, and personal difficulties many CSHCN and their families face. Check out our previous installments on quality of care, access to services, demographic and health characteristics, and family-centered care.
Nearly 1.5 million California children ages 0 to 17, and more than 15 million children nationwide, have special health care needs—meaning they need health and related services of a type or amount beyond that required by children generally due to chronic physical, developmental, behavioral, or emotional conditions. When this definition of children with special health care needs (CSHCN) is expanded to also include those with a diagnosed health condition and at least one functional difficulty, the numbers jump to 1.9 million statewide—22% of the child population—and nearly 19 million nationally.
For children who meet the narrower CSHCN definition, new estimates for 2023 highlight some of the impacts their ongoing health conditions can have, on themselves and on those close to them. Here are 10 indicators that paint a picture of daily life for CSHCN families—beginning with 5 that KidsData can now measure again for the first time in more than a decade:
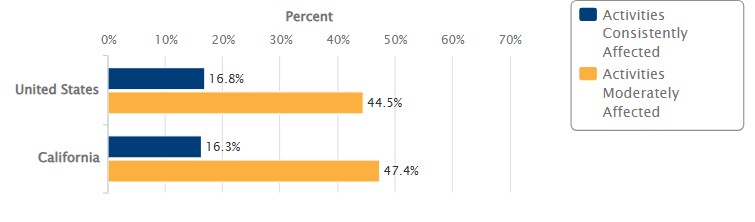
1. More than 60% of CSHCN in California and the United States have conditions that moderately or consistently affect their ability to do the same things as other kids their age. Nationally, the share of publicly insured CSHCN whose conditions consistently affect their daily activities (22%) is twice as high as the share with private insurance (11%).
2. For California CSHCN who require therapies, medications, bandage changes, or other health care at home, more than a quarter have families who spend at least 11 hours each week providing that care.
3. More than 1 in 4 CSHCN in California visited the ER at least once in the previous year, and 1 in 10 had at least two visits. Statewide and nationally, ER visits are more common among CSHCN with public health insurance compared with those with private coverage.
4. Around 6% of California and U.S. CSHCN had an overnight hospital stay in the previous year. Among Hispanic/Latino CSHCN in California, the share was 4%; for white CSHCN, 8%.
5. Yearly out-of-pocket health care costs were higher than $1,000 for 22% of California CSHCN. Public health insurance programs kept costs manageable for many families—more than 95% of CSHCN with public insurance exclusively had out-of-pocket health costs of less than $500 in the previous year.
Updated data also point to greater challenges related to education and employment for CSHCN families:
6. The share of California CSHCN who missed 11 or more school days in the previous year due to illness or injury was 19%—around 5.5 times higher than the share of children without special health care needs.
7. The percentage of CSHCN who had ever repeated a grade in school—statewide (6%) and nationally (9%)—was more than double that for their peers.
8. An estimated 23% of CSHCN in California had parents or other family members who left a job, took a leave of absence, or cut back their work hours in the previous year because of the child’s health. Among CSHCN with more complex health care needs (those not managed primarily by prescription medications), the share was 27%.
9. For family members who continue working, health insurance often keeps them in their jobs. An estimated 18% of California CSHCN and 14% of CSHCN nationwide had someone in their family who avoided changing jobs in the previous year due to concerns about maintaining coverage.
10. Perhaps as a result of higher-than-average caregiving, economic, employment, and personal stress, parents of CSHCN are more frequently aggravated with their children than parents without CSHCN. Around 2% of children without special health care needs had parents who usually or always felt aggravation from parenting, compared with 20% of CSHCN.
Read more on KidsData about how policies and systems can promote the well-being of CSHCN and their families.
Health Data Resources
California ranks 32nd among states in overall child well-being, according to the Annie E. Casey Foundation’s latest KIDS COUNT Data Book—up from 35th in 2024. The state performed among the best in the health domain (11th) and among the worst for economic well-being (44th).
Social Determinants of Health Dashboards for Native Hawaiians and Pacific Islanders
The NHPI Data Policy Lab at the UCLA Center for Health Policy Research has launched state- and county-level data dashboards focused on the social determinants of health for Native Hawaiian and Pacific Islander communities.
Recently Released Data
We recently released data about impacts of special health care needs on children and families. See links to the latest here.
Posted by kidsdata.org
Post Comment
New Data Point to Resilience in California’s Licensed Child Care System. How Do We Sustain Progress? Guest Commentary by Natalie Rivera and Rowena Kamo
Licensed Child Care Spaces in California: 2000 to 2023
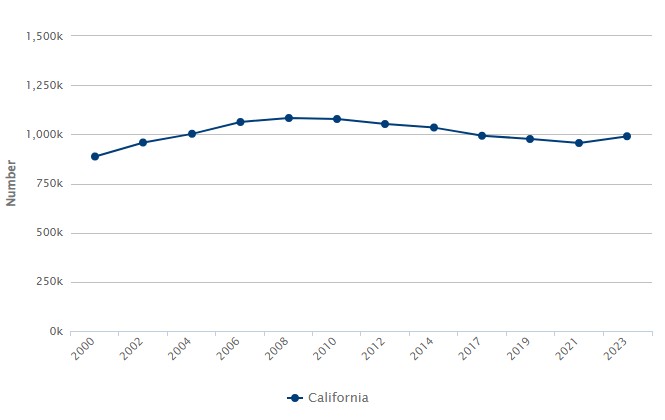

Guest authors Natalie Rivera (left), research and policy associate at the California Child Care Resource & Referral Network, and Rowena Kamo (right) explore state and local trends in licensed child care supply and cost—and what they reveal about California’s early childhood system.
The California Child Care Resource & Referral Network (R&R Network) is excited to announce the release of our 14th biennial California Child Care Portfolio, with county- and state-level data available on KidsData.org. The portfolio tracks trends in licensed child care supply, demand, and cost, and provides data on family demographics, income, and expenses.
Key Findings
Data for 2023 show California’s licensed child care supply remains steady. Compared with 2021, the state recorded modest gains of:
-
139 licensed child care facilities
- 60 child care centers
- 79 family child care homes (FCCHs)
- 27,258 licensed child care spaces (3%)
- 23,643 center spaces (3%)
- 3,615 FCCH spaces (1%)
This two-year increase in FCCH capacity is the first since 2008, and the increase in center capacity is the largest since 2006. While this growth signals progress, the number of spaces statewide remains well below levels recorded prior to and during the Great Recession, underscoring the ongoing need for sustained investment and support for providers.
Changes in supply varied by region and county. At the local level, there were substantial shifts in licensed child care capacity between 2021 and 2023. Regionally, counties in the R&R Network’s Bay Area region experienced an overall increase in licensed spaces of 7%, while the North region saw a net decrease of 2%. Variation at the county level was even more dramatic; for instance:
-
In the R&R South Region
- San Bernardino: +14%
- Imperial: -25%
- In the R&R Central Valley Region
- Mariposa: +64%
- Inyo: -39%
- In the R&R Bay Area Region
- Santa Clara: +15%
- Napa: -5%
- In the R&R North Region
- Glenn: +33%
- Modoc: -45%
Policy Priorities
Continued investments in child care systems are critical to supporting California’s working families and ensuring the stability and growth of child care programs. Program and policy options include:
Paying providers fairly. In California, the median cost of licensed FCCH care in 2022 was $1,232 per month for an infant and $969 per month for a preschooler. This means an FCCH provider caring for three infants and three preschoolers on average earned approximately $6,600 per month in gross income—more than $1,000 lower than the state’s median household income—before accounting for any business expenses.
A key step toward protecting the current supply of licensed child care is minimizing the financial strain on providers who are operating at a loss. One way the state can assist is to reform its subsidized child care reimbursement rate structure to one that reflects the true cost of care. Current reimbursement rates are based on regional market rates, or the price that a consumer is willing to pay, which may not accurately represent the actual cost of providing child care.
California also can permanently adopt a payment system based on enrollment rather than attendance. The overhead costs of running a child care business remain constant regardless of daily attendance, and providers need predictable, stable revenue to plan and sustain their operations.
Ensuring all families have access to affordable child care. Only around one in four California children with working parents had access to a licensed child care space in 2023. And availability is only part of the equation. Spending on child care represents a substantial share of the household budget for many families—in some cases on par with housing expenses. A universal child care system could ensure that affordable child care is available to every family who needs or wants it, providing crucial support for children’s development and for parents’ ability to work, pursue an education, or participate in training opportunities.
Protecting federal and state investments in child care. Funding from Head Start, TANF/CalWORKs, and the Child Care and Development Block Grant, among other sources, sustains California’s child care programs. Loss of federal funds into the state’s early childhood system means less availability of child care and more children and families in need of assistance.
Providers also rely on public assistance programs, such as SNAP/CalFresh for food assistance and Medicaid/Medi-Cal for health insurance. Cuts to these programs deepen providers’ economic insecurity, further threatening the stability and well-being of our state’s early childhood education workforce.
Visit the R&R Network’s site for more policy ideas and child care resources.
Posted by kidsdata.org
Post Comment
Air Pollution Is a Big Problem for California’s Littlest Lungs
Air pollution threatens the health of people of all ages, but children are especially vulnerable—their bodies and vital organs are still developing, they breathe more air (and with it, pollutants) relative to their size, and they generally spend more time outside or closer to the ground, where pollutant concentrations often are highest. Children also are uniquely at risk for negative developmental outcomes associated with exposure to air pollution, which can disrupt their cognition, behavior, academic performance, and economic productivity in adulthood.
Average Concentration of Fine Particulate Matter (PM2.5) in the Air, by County: 2023
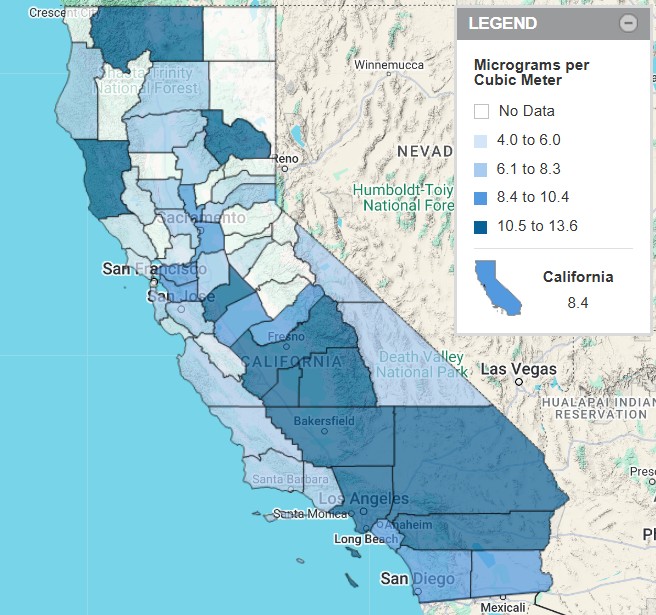
Despite its strong air quality regulations and leadership on environmental policy, California is home to some of the most polluted air in the nation. In 2023, 17 counties recorded average airborne concentrations of fine particulate matter—tiny inhalable particles (2.5 microns or smaller) emitted from vehicles, wildfires, and other natural and industrial processes—above the current national primary standard of 9 micrograms per cubic meter. Concentrations above this level have been shown to be harmful to human health, especially among sensitive groups like children. In Southern California and the San Joaquin Valley, most counties averaged unhealthy PM2.5 concentrations in 2023.
These regions also reported the most days with average ozone concentrations above the public health standard of 0.070 parts per million. Kern, Los Angeles, Riverside, and San Bernardino counties each saw at least 52 days of ozone concentrations exceeding this threshold in 2023—the equivalent of at least one unhealthy air day per week.
Protecting the air we share benefits all Californians. Read more about policy and program strategies to safeguard kids and other sensitive groups, and to reduce the disproportionate burden of air pollution in lower-income areas and among communities of color.
Health Research and Resources
California Wildfires
- A new PRB research highlight, “Wildfires Devastated Their Communities. Will Californians Stay Put?,” examines the relationship between wildfire severity and migration patterns. The evidence suggests that only the most destructive fires push people to move away from affected areas.
- The California Essentials for Childhood Initiative shares ways to help children cope with stress from wildfires, and the UCLA Center for Health Policy Research reminds us that wildfires can have long-term mental health impacts.
Medicaid
- A series of fact sheets from the Center for Children and Families at Georgetown University focuses on how Medicaid promotes maternal and infant health, serves young people with disabilities or special health care needs, and provides other essential well-being support to children and families.
- Many young adults without health insurance are eligible for Medicaid. A new brief by the Urban Institute explores the characteristics of this group to inform outreach and enrollment efforts.
Adverse Childhood Experiences
- The Children’s Partnership has released a new brief with data on adverse childhood experiences (ACEs) in California and policy recommendations for investing in whole-child systems of care.
Recently Released Data
We recently released data about air quality. See links to the latest here.
Posted by kidsdata.org
Post Comment