

Policymakers Can Curb Rising Child Poverty Rates
Percentage of Children Ages 0 to 17 Living in Poverty According to the
Supplemental Poverty Measure: 2023
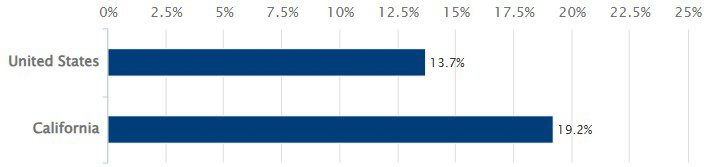
Nearly one in five California children live without enough resources to meet their most basic needs. Statewide, according to the latest Supplemental Poverty Measure (SPM) data, there are more children in poverty than there are in the entire Bay Area (Alameda, Contra Costa, Marin, Napa, San Francisco, San Mateo, Santa Clara, Solano, and Sonoma counties combined)—or in Maryland, Massachusetts, or 35 other U.S. states.
Expansions to the social safety net during the COVID-19 pandemic brought California’s SPM child poverty rate to a historic low in 2021 (7.5%). Following the expiration of these investments, SPM rates returned to pre-pandemic levels (19%) in 2023. These trends demonstrate the powerful and rapid impact that policymakers’ actions can have on the economic well-being of millions of children and families.
Read more about evidence-based policies that could reverse rising poverty rates statewide and nationally.
More Children’s Health Resources
PRB has released two new articles highlighting recent findings in child and family health research.
From the Emergency Room to Eviction?
In a national study of families with children, a hospitalization or visit to the emergency room in the previous year was associated with a five-percentage-point increase in the probability of experiencing later housing hardship (frequent moves, difficulty paying rent or mortgage, eviction, or homelessness). Building financial security before, during, and after an unexpected hospital visit—e.g., through paid leave, housing assistance, and child allowance policies—could reduce the impacts of these health shocks on families.
Vaccination During Pregnancy May Reduce Whooping Cough in Infants
Vaccination during pregnancy is the primary strategy for whopping cough (pertussis) prevention in infants. A new analysis finds that after recommendations for all pregnant people to receive a Tdap vaccination were announced in 2012, annual rates of pertussis among infants in the U.S. fell by 54 cases per 100,000. That there was no significant change in pertussis deaths among infants could suggest that Tdap coverage among pregnant people remains too low to reduce mortality, or that mothers of the highest risk-infants are not being reached effectively.
Recently Released Resources
We recently released data about family income and poverty. See links to the latest here.
Posted by kidsdata.org
Post Comment
Juvenile Felony Arrests in California Rise by 76% in Two Years
A statement about data access and integrity:
KidsData remains committed to providing high-quality data and fact-based information to anyone who cares about advancing health and well-being in our state and across our nation.
Without evidence, we risk obscuring or distorting the realities that California’s children and families experience. KidsData exists to describe those realities in detail, so that they can guide sound decision-making.
Read a statement from PRB’s president, Jennifer Sciubba, here.
Youth who become involved with the justice system are at increased risk for negative outcomes that can have long-term consequences, such as mental health problems, dropping out of school, difficulty with employment, and rearrest. Most young people who are detained have experienced some form of trauma during childhood, and system involvement can retraumatize them, often with no benefits for crime control or public safety.
Number of Juvenile Felony Arrests per 1,000 California Young People Ages 10 to 17:
2007 to 2023
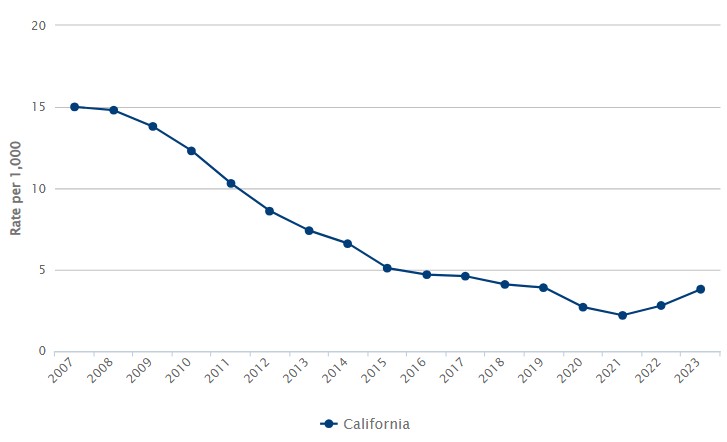
For the first time since 2007, California recorded two consecutive years of rising juvenile felony arrest rates in 2022 and 2023. Young people ages 10 to 17 were arrested for felony offenses at a rate of 3.8 arrests per 1,000 juveniles in 2023—up from a forty-plus-year low of 2.2 per 1,000 in 2021, and similar to rates before the COVID-19 pandemic (3.9 per 1,000 in 2019). This two-year upswing is the largest since the late 1980s.
There were 6,913 more juvenile felony arrests statewide in 2023 than in 2021—an increase of 76%. The number of arrests involving girls jumped by 87% over this period, while arrests of boys climbed 73%.
Violent and property offenses together accounted for nearly 70% of the state’s juvenile felony arrests in 2023, drug/alcohol and sex offenses accounted for less than 5%, and driving under the influence, hit-and-runs, weapons charges, and other crimes made up the remaining share. These percentages resemble the distributions for 2020 and 2019.
Policymakers and leaders from multiple sectors can play a role in improving how society responds to youth behavioral problems and juvenile crime. Explore policy and practice options on KidsData.
Children’s Health Resources
2025 California County Scorecard of Children’s Well-Being
Children Now has released the 2025 edition of its interactive data scorecard tracking 40 indicators of child well-being. Explore the latest county-level figures, compare data across racial/ethnic groups, and examine trends over time.
A 2024 Review of Child Care and Early Learning in the United States
The Center for American Progress’s updated report and interactive data dashboard on child care and early learning in the United States illustrate the urgent need for holistic public policymaking and robust investments that support young children, families, and early childhood educators.
Stepfathers Are Stepping Up—and Stepchildren Are Benefitting
A new PRB research highlight summarizes recent findings linking stepchildren’s feelings of closeness and participation in activities with their stepfathers to positive socio-emotional outcomes in adolescence.
Opportunity
ACT Conference: Community Strategies to Help All Children Thrive
All Children Thrive (ACT) California will host its 2025 conference on positive and adverse childhood experiences in Sacramento on April 2 and 3. Attendees can choose from five in-depth conference tracks: Community Agency and Power, Culture as a Method to Address Trauma, Equity in Action, Your Role in Healing Trauma, and Youth Power to Action (for attendees ages 14 to 25).
Recently Released Data
We recently released data about juvenile arrests. See links to the latest here.
Posted by kidsdata.org
Post Comment
Kindergarten Immunization Rates Return to Pre-Pandemic Levels, but Gaps Remain
Immunizations are among the most successful and cost-effective preventive health care interventions, protecting millions of children worldwide from serious and potentially fatal infectious diseases. Among U.S. children born between 1994 and 2023, an estimated 500 million illnesses will be prevented and more than 1.1 million lives saved by routine childhood vaccinations, at a net savings of nearly $2.7 trillion for society.
Percentage of California Kindergarteners With All Required Immunizations: 2021-22 School Year
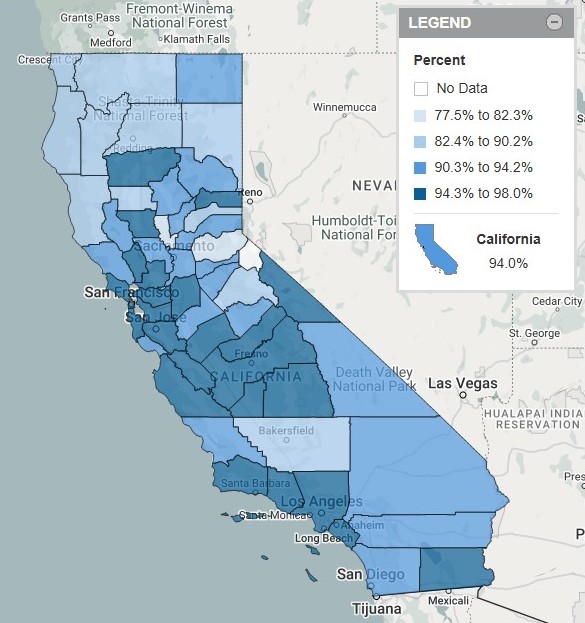
The latest data on kindergarten immunizations in California are mixed. On one hand, 94% of the state’s more than 500,000 kindergarten students had received all doses of required vaccines—diphtheria, tetanus, and pertussis (DTP); measles, mumps, and rubella (MMR); hepatitis B; polio; and varicella—prior to entering school in 2021-22. This figure is up from 92.8% for the 2020-21 school year and is similar to pre-pandemic levels (94.3% in 2019-20). California’s rebound stands in contrast to national trends, which show falling coverage for each vaccine over this period, followed by further drops through the 2023-24 school year.
Still, more than 30,000 kindergarteners statewide had not received all required immunizations in 2022—fewer than 1 in 20 (1,511) of whom were permanently exempt from one or more immunizations due to their physical condition or medical circumstances.
Furthermore, immunization coverage at the local level is uneven. For example, more than 97% of kindergarteners in Colusa and Monterey counties were fully vaccinated in 2022, compared with fewer than 80% in El Dorado and Sutter—two counties with high proportions of kindergarteners with ‘other exemptions’ available to those receiving instruction through an individualized education program (IEP), home-based private school, or non-classroom-based independent study program.
To protect children, schools, and communities from vaccine-preventable disease outbreaks, policymakers can work to ensure that all families—in particular, those not in contact with settings where immunizations are required (such as licensed child care, preschool, and public and private K-12 schools)—have access to a regular source of high-quality health care, affordable and accessible vaccinations, and science-based vaccine information. Read more about strategies to increase immunization rates.
Wildlife Recovery Resources
Emergency help and resources are available for individuals and families impacted by the devastating wildfires in Los Angeles County. Follow the links below for federal, state, and local information and guidance.
- FEMA: California Wildfires and Straight-Line Winds
- CDC: Wildfire Smoke and Children
- State of California: Help and Info for People Affected by the Wildfires
- Medi-Cal: Emergency and Disaster Assistance Information Questions & Answers
- Los Angeles County: Emergency Information and Recovery Resources
- City of Los Angeles: Wildfire Recovery Resources
Opportunities
On January 29, at 12:00 p.m. PST, experts from the UCLA Center for Health Policy Research and Cal State Fullerton will share results from a new study on CalFresh access and use among students pursuing higher education.
Examining Measures of Disability and Health Care Need for Children and Youth
Join KidsData’s Beth Jarosz at the 2025 Applied Demography Conference in Tucson, Arizona, on February 4, at 11:15 a.m. MST, where she’ll present new analyses of three measures of disability prevalence among U.S. children and what they reveal about the sociodemographic characteristics of children identified using each measure.
Children’s Health Resources
KIDS COUNT Data Resource Guide
This guide, developed by PRB for the Annie E. Casey Foundation’s KIDS COUNT network, provides practical information and advice on how to use major U.S. sources of data on the well-being of children and families. The guide includes an overview of each major data source—what data are available, how to access those data, and considerations for use—along with some general best practices for assessing reliability, making comparisons, and disaggregating by race and ethnicity.
Kids in Common Data Book Dashboard
Explore key indicators for Santa Clara County children and families on Kids in Common’s new interactive data dashboard.
Exclusionary Discipline Threatens Youth Mental Health, but Protective Factors Can Help
A new PRB research highlight summarizes recent findings linking exclusionary discipline practices—such as detention and suspension—with anxiety and depression in students who are disciplined. Protective factors, like extracurricular activities and healthy relationships with parents, are effective buffers against mental health symptoms for all young people, regardless of whether they experience exclusionary discipline.
Recently Released Data
We recently released data about immunizations. See links to the latest here.
Posted by kidsdata.org
Post Comment
Sunsetting Pandemic Policies Highlight Safety Net’s Role in Reducing Child Poverty
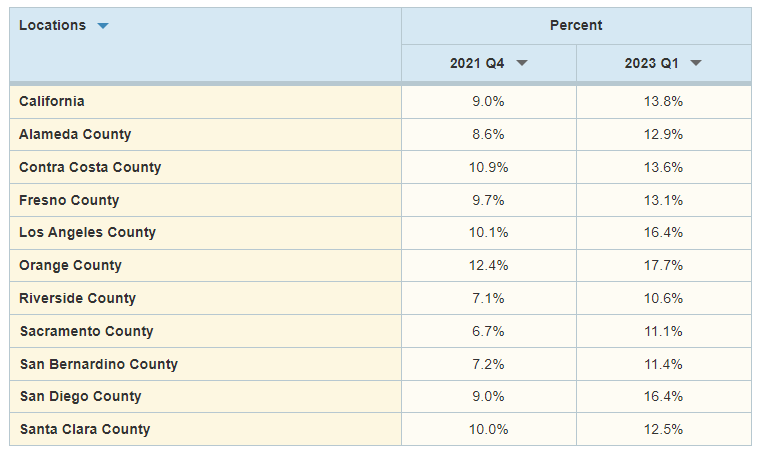
Percentage of Children Ages 0 to 17 Living in Poverty, According to the California Poverty Measure: Fall 2021 to Early 2023

Patricia Malagon, guest author from the Public Policy Institute of California, explores how changes in California’s social safety net during the COVID-19 pandemic have shaped poverty trends across the state.
The California Poverty Measure (CPM), developed jointly by the Public Policy Institute of California (PPIC) and the Stanford Center on Poverty and Inequality, provides a robust measure of Californians who lack the resources to meet basic needs, accounting for local costs of living as well as safety net resources. The CPM poverty rate among Californians of all ages rose from 11.7% in fall 2021 to 13.1% in early 2023, while rates among children jumped even more dramatically. Now that pandemic-era safety net expansions have ended, this upward trend is likely to continue.
To address data limitations and to be responsive to rapidly changing policies, the CPM pivoted during the pandemic to projecting annual poverty rates from pre-pandemic data. For the early 2023 CPM, we combined the 2019 American Community Survey with data on safety net program and economic conditions in January through March 2023. (PPIC technical appendices provide details on data and methodology.)
Because most safety net programs focus on children, program expansions—and their expiration—have had a particularly large impact on child poverty. According to the CPM, child poverty in California jumped from 9% in fall 2021 to 13.8% in early 2023, yet remained below pre-pandemic levels. In early 2023, 1.2 million California children were living under the CPM poverty line—$40,765 annually, on average, for a family of two adults and two children renting their home. And about 195,000 children (2.2%) were living in deep poverty—with less than half the family resources needed to meet basic needs.
In early 2023, according to the CPM, child poverty was highest in families in which the oldest adult was unemployed (29.8%) and in single-parent families (25.6%), followed by families in which the oldest adult had not finished high school (24.1%) or was not a U.S. citizen (24.6%). Across racial/ethnic groups with data, poverty was highest among Hispanic/Latino children (18.2%).
Across counties with data, child poverty was highest in Orange County (17.7%), followed by Los Angeles and San Diego counties (both 16.4%); Riverside County had the lowest rate (10.6%). Across legislative districts, child poverty ranged from 4.7% in Assembly District 71 (San Diego County) to 29.8% in Assembly District 57 (Los Angeles County). Later in the fall, PPIC will release additional estimates for local areas, using two years of combined CPM data.
In early 2023, participation in safety net programs lifted more than 1 in 7 California children, or about 1.3 million kids, out of poverty. CalFresh alone—the only safety net program with pandemic expansions still in effect at the time—lowered child poverty by 5 percentage points; only tax credits had a greater poverty-reducing effect (5.1 percentage points) among measured programs. CalWORKs, Supplemental Security Income, housing subsidies, and other nutrition programs (school meals and WIC) lowered child poverty by less than 2 percentage points each.
If poverty rates continue rising as we expect, this could be an important policy issue next year among newly elected California legislators, many of whom may see poverty increases in their districts. PPIC will continue to monitor poverty trends and assess policies that aim to help Californians meet their basic needs.
Read more from PPIC on poverty and inequality in California.
Children’s Health Resources
Approximately 9% of federal spending went to children in 2023, and this figure is projected to fall to 6% over the next decade, according to Urban Institute’s new analysis of federal expenditures on children from 1960 to 2023.
You Count Data Hub: California Youth Homelessness Timeline
The California Homeless Youth Project has developed a comprehensive visual timeline pairing youth homelessness counts with legislative history and budget allocations from 2011 to 2023.
Launching Lifelong Health by Improving Health Care for Children, Youth, and Families
A new consensus report from the National Academies of Sciences, Engineering, and Medicine explores a transformed child and adolescent health care system—one that rethinks health care financing, public health investment, community partnerships, and accountability—to better meet all children’s needs.
Debt in America: An Interactive Map
New state and national data on medical, student loan, and auto/retail/credit card debt among young adults are available now on the Urban Institute’s Debt in America dashboard. See how young people in communities of color are faring compared with their peers in white communities, and explore policy and program options to support financial stability for young adults in the accompanying blog.
Recently Released Data
We recently released data about family income and poverty. See links to the latest here.
Posted by kidsdata.org
Post Comment
Children’s Asthma Hospitalizations Return to Pre-Pandemic Levels
Number of Hospital Discharges for Asthma Among California Children, by Age Group:
2016 to 2022
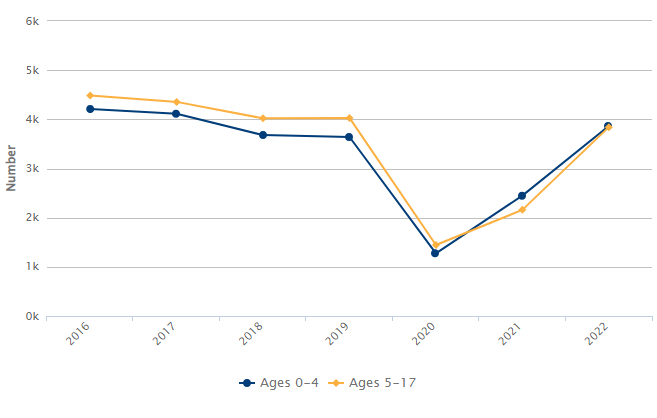
After a sharp drop in 2020 and 2021, childhood asthma hospitalizations statewide rebounded to pre-pandemic levels in 2022. That year, not including treat-and-release emergency room visits, there were more than 7,700 hospitalizations for asthma—a rate of almost 9 discharges per 10,000 children ages 17 and younger.
At the local level, wide variation in asthma hospitalization rates persisted over this period. In 2022, Fresno County saw more than 13 asthma hospitalizations per 10,000 children (up from 5.1 in 2020)—more than 3.5 times Santa Barbara County’s rate of fewer than 4 per 10,000 (up from 1.4 in 2020).
Similar to other standard health measures that have pointed to notable improvements in children’s well-being immediately after the COVID-19 outbreak (see trends in emergency room visits, cases of child maltreatment, and sexually transmitted infections), it’s not clear whether falling asthma hospitalizations in 2020 and 2021 were due to fewer children and families reporting problems and seeking treatment, or to social distancing measures that reduced children’s exposure to asthma triggers—such as exercise, outdoor allergens and pollutants, and viruses in school and child care settings—and in turn contributed to preventing serious attacks.
Whatever the reason for the decline, it appears to have been temporary. The latest data reinforce the urgent need for evidence-based strategies to improve asthma management, reduce hospitalizations, and address disparities in asthma burden.
Opportunities
Harnessing Local Data for Upward Mobility
Urban Institute’s Upward Mobility Initiative will host an in-depth look at its new Upward Mobility Data Dashboard on Wednesday, October 2, from 3:00 p.m. to 4:45 p.m. EDT. During this hybrid event, speakers will share the latest tools, research, and real-world examples of data-driven initiatives in communities.
California Health Interview Survey (CHIS) Annual Data Release
On Thursday, October 3, from 12:00 p.m. to 1:00 p.m. PDT, the UCLA Center for Health Policy Research will release data from the 2023 CHIS, which features more than 50 new topics and questions. Join CHIS’s principal investigator and director for a virtual discussion of some of the most notable findings.
Engaging Communities in Research and Policy on Structural Racism and Population Health
The Center for Antiracism Research for Health Equity at the University of Minnesota School of Public Health will convene its Ignite the Spark Scholars Program cohort on Friday, October 25, from 8:00 a.m. to 5:00 p.m. CDT. This hybrid event will bring together changemaking leaders from across the United States for a day of panels, workgroups, and networking opportunities.
Children’s Health Resources
How Do Children and Society Benefit From Public Investments in Children?
Public programs that invest in children generally have a positive return on investment for society, and some also eventually pay for their cost—and more—to government through increased tax revenues and decreased spending on criminal justice and public assistance programs for adults, says this new brief from Urban Institute.
Supporting Youth Economic Mobility Through Employment-Focused Strategies
WorkRise’s new report on youth economic mobility reviews the evidence of programs and practices that help young workers succeed and advance in the labor market. An accompanying research summary explores where further research could inform more effective programs, approaches, and policies to improve employment prospects for young people now and in the future.
Recently Released Data
We recently released data about asthma and health care. See links to the latest here.
Posted by kidsdata.org
Post Comment
Spotlight on Children With Special Needs (Part 4): Quality of Care
This fourth installment in our series on children with special health care needs (CSHCN) explores the quality of care that CSHCN receive. Check out the third in this series, which examines strengths and challenges related to CSHCN’s access to services, the second on characteristics of CSHCN, and the first on family-centered care for families with CSHCN.
Percentage of California CSHCN Ages 0 to 17 Who Received Care in a Well-Functioning System of Health Services: 2022
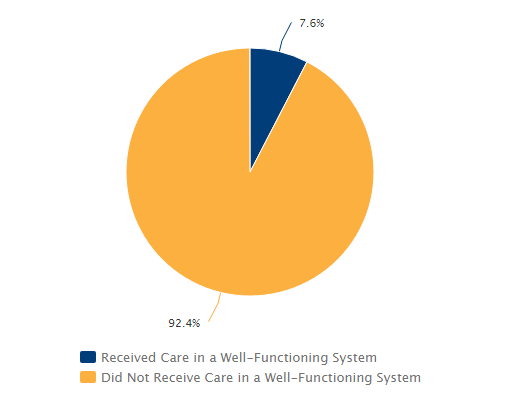
Note: A child who receives care in a “well-functioning” health system must have adequate, continuous insurance coverage; receive medical and dental preventive care; have no unmet needs or barriers to accessing services; receive care within a medical home; and get support for the transition from adolescent to adult health care. Additionally, the child’s family must feel like a partner in shared decision-making with health providers.
A well-functioning health system supports the well-being and development of children with special health care needs (CSHCN). Yet, in California in 2022, fewer than 1 in 13 CSHCN received care in a system meeting minimum federal quality-of-care standards. Among children without special health care needs, the share receiving care in a well-functioning system was twice as high, but still lower than 1 in 6.
CSHCN have or are at increased risk for a chronic physical, developmental, behavioral, or emotional condition and require health and related services of a type or amount beyond that generally required by children. CSHCN often need more specialized and comprehensive medical care than their peers, and they are more likely to experience social-emotional issues, academic struggles, and other adversities that can complicate their care. Their families, too, may deal with greater caregiving burdens and stress—and face barriers to high-quality care due to racial, ethnic, and socioeconomic factors.
Each component of a well-functioning health system contributes to ensuring that children receive the high-quality care they need. Let’s explore some components and examine how well CSHCN in California are being served.
Care Within a Medical Home
A medical home is a model of primary care in which children receive comprehensive and continuous care to achieve optimal health outcomes. In 2022, 31% of CSHCN in California received care within a medical home, compared with 38% nationally.
Access to a medical home varies by family resources. Just 16% of California CSHCN living below the federal poverty threshold ($27,479 for a family of two adults and two children in 2022) had a medical home according to the latest estimates, whereas 40% of CSHCN in families with incomes at or above 400% of the poverty threshold did. Additionally, California CSHCN covered by public health insurance only were less likely to receive care within a medical home than those with only private insurance (25% vs. 39%, respectively).
Racial/ethnic disparities also exist: In 2022, 24% of Hispanic/Latino CSHCN statewide received care within a medical home, compared with 39% of white CSHCN.
Care Coordination
Coordination of health care across providers and services can maximize children’s health outcomes and reduce stress on families. For children with complex needs especially, care coordination helps them and their families effectively navigate the health care system and receive the right care at the right time. However, 2022 data show that among California CSHCN needing care coordination in the previous year, only half received this aspect of care within a medical home. By comparison, around two-thirds of children without special health care needs received the care coordination they needed.
Health Insurance
There remains room for improvement to ensure all children have continuous and adequate health insurance coverage. Insurance is considered adequate when it meets a child’s needs, allows access to needed providers, and has reasonable out-of-pocket costs. Although a vast majority of CSHCN in California (96%) were consistently insured in 2022—meaning that they were covered during all 12 months of the prior year—only 59% of CSHCN had adequate health insurance at the time of survey, compared with 71% of children without special health care needs.
Gaps in access to adequate insurance, care coordination, medical homes, and well-functioning health systems highlight ongoing challenges faced by CSHCN and their families. Read more about policy implications of these findings and explore solutions to improve care for CSHCN.
This spotlight was authored by KidsData intern Athira Rajiv. Funding for KidsData’s latest information on CSHCN was provided by the Lucile Packard Foundation for Children’s Health.
Opportunities
BlackECE Symposium on Policy, Practice, and Research
On August 9 and 10 in Sacramento, Black Californians United for Early Care and Education will bring together researchers, educators, policymakers, advocates, providers, and families in research-based learning to advance culturally affirming policies and practices across California’s early learning and care system.
The Live Beyond Campaign: Raising Awareness to Help Californians Heal From ACEs
On Tuesday, August 13, from 12:00 p.m. to 1:15 p.m. PDT, the ACEs Aware Learning Center will host California Surgeon General Diana Ramos, former California Surgeon General Nadine Burke Harris, adverse childhood experiences (ACEs) experts, and youth advisers in a discussion of Live Beyond, a new campaign to raise awareness and offer resources to youth and young adults affected by ACEs and toxic stress.
Children’s Health Resources
Perceived Social and Emotional Support Among Teenagers [PDF]
A new report by the Centers for Disease Control and Prevention’s National Center for Health Statistics finds that parents may overestimate how much social and emotional support their teenage children are getting. In a nationally representative sample of teens ages 12-17 and their parents, parents consistently reported higher levels of support for their teens than what teens reported themselves. According to parent reports, 77% of teens always received the support they needed—almost three times higher than the 28% reported by teens.
Building Strong Foundations: Children’s Mental Health
The National Institute for Health Care Management Foundation has released an infographic highlighting data on mental health issues and suicides among children and teens, underdiagnosis and undertreatment of disorders, and strategies to promote youth mental health and improve support.
Early Childhood Adversity May Affect Neurological and Cognitive Development
A new study from the Eunice Kennedy Shriver National Institute of Child Health and Human Development suggests exposure to ACEs between ages 0 and 7 is associated with deficits in neurocognitive development. Researchers found children exposed to early childhood adversity scored lower on tests of visual-motor and sensory-motor skills, listening-vocal skills, intelligence, and academic achievement when compared with children with low exposure to adversity.
Recently Released Data
We recently released data about family structure and quality of care for children with special health care needs. See links to the latest here.
Posted by kidsdata.org
Post Comment
Latest Data Show No Improvements on Two Critical Childbirth Outcomes
Share of Infants Born Weighing Less than 5 Pounds, 8 Ounces: 1995 to 2022
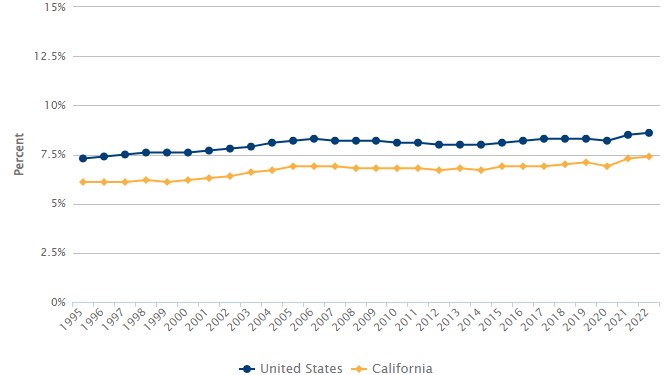
The United States lags well behind other affluent nations on healthy birthweight and other maternal and newborn health outcomes. Despite substantial investment in childbirth systems and services, Americans of childbearing age today are more likely to have low birthweight babies than to have been born at low birthweight themselves. More than two and a half decades of data on rates of low birthweight show increases of more than 16% nationally and 20% in California since 1995.
Rates of infants born preterm—before 37 weeks’ gestational age—have similarly not improved overall since 2008 (the first year for which comparable estimates are available). After declining steadily between 2009 and 2014, trends then reversed, and in 2022 percentages for the United States (10.4%) and California (9.1%) had returned to 2008 levels.
Much more can be done to care for mothers and babies before, during, and after pregnancy—not only to improve childbirth outcomes overall but to reduce long-standing disparities by race/ethnicity, geography, and other sociodemographic factors. Read about evidence-based policy, system, and practice options that could influence low birthweight and preterm birth rates.
Opportunities
Building Trust in Healthcare Among Historically Marginalized Pregnant Women
The Standing Committee on Reproductive Health, Equity, and Society of the National Academies of Sciences, Engineering, and Medicine will hold the last webinar in its five-part series, Maternal Health Disparities: The Women Behind the Data, which explores social determinants of health that negatively impact maternal health outcomes. On Friday, June 28, from 12:00 p.m. to 1:00 p.m. ET, guest speakers and panelists will discuss building trust amongst historically marginalized pregnant women.
Cutting Child Poverty in Half and More
On Thursday, July 11, at 2:00 p.m. ET, the Foundation for Child Development will host a webinar exploring insights from their newly released paper, Cutting Child Poverty in Half and More: Pandemic-Era Lessons From Child and Family Advocates and Organizers. A panel of parents, community organizers, and policy advocates will discuss takeaways from the groundbreaking federal policy changes that achieved unprecedented success in driving down child poverty in 2020 and 2021.
Children’s Health Resources
For the second year in a row, the Annie E. Casey Foundation’s KIDS COUNT Data Book ranks California 35th among U.S. states in overall child well-being. Explore the data and learn what the latest national fourth-grade reading and eighth-grade math scores reveal about pandemic learning losses.
An Expanded Approach to the Ascertainment of Children and Youth With Special Health Care Needs
More than 4 million U.S. children with diagnosed health conditions and functional difficulties who experience health impacts similar to those of children with special health care needs (CSHCN) are not identified as CSHCN by the standard screening instrument, according to a new study published in Pediatrics. The researchers propose an expanded approach to counting CSHCN, and a companion piece discusses policy and research implications.
Family Experiences With Medi-Cal Renewal
Earlier this year, The Children’s Partnership conducted focus groups with parents and guardians of color and those with limited English proficiency to learn about their families’ experiences during the Medi-Cal “unwinding” period (after pandemic enrollment protections ended), which aspects of the renewal process work well, and what needs to change in order to keep their children covered. A summary slide deck and advocacy fact sheet based on their observations, recommendations, and concerns are available now.
The National Alliance to Advance Adolescent Health, supported by the Lucile Packard Foundation for Children’s Health, has published a national report, a five-state case study, and three policy briefs on what happens to young adults with disabilities when they age out of public programs. Together, these resources identify policies and strategies to ensure and improve access to adult benefits, reduce disruptions to care, and address inequities, with a focus on the experiences of Black youth.
Recently Released Data
We recently released data about demographics and low birthweight and preterm births. See links to the latest here.
Posted by kidsdata.org
Post Comment
Spotlight on Children With Special Needs (Part 3): A Look at Access to Care
The third in our series on children with special health care needs (CSHCN) highlights strengths and challenges related to CSHCN’s access to services. Also read the second in this series, on characteristics of CSHCN, and the first, on family-centered care for CSHCN families.
Nearly 1.4 million California children ages 0 to 17—and more than 15 million children nationwide—have or are at increased risk for a chronic health condition and require care and services beyond that required by children generally.
Getting timely, appropriate, and affordable care is a major problem for many families with children with special health care needs (CSHCN). Major barriers to care, especially in California, include a fragmented system of services and an insufficient, shrinking workforce of pediatric subspecialists. Beyond service system barriers, social factors and practices—such as poverty and discrimination—influence access to care and, ultimately, health outcomes.
New and updated 2022 data from the National Survey of Children’s Health reveal both bright spots and areas for action in access to health services for California’s CSHCN.
Bright spots include:
- Ninety percent of California’s CSHCN who needed specialist care in the previous year were able to receive that care. Specialist care includes visits and services from providers who specialize in one area of health care other than mental health—such as surgeons, heart doctors, and allergists.
- California’s CSHCN with emotional or behavioral health conditions were more likely to receive mental health treatment or counseling than the national average. In California, 74% of CSHCN ages 3 to 17 with a diagnosis of attention deficit disorder (ADD) or attention deficit/hyperactivity disorder (ADHD), anxiety, behavioral or conduct problems, or depression had received counseling or treatment in the previous year. Meanwhile, 63% of CSHCN in the United States with those diagnoses had received services.
- CSHCN in California were more likely to have received dental or oral health care visits compared with peers. In California, 91% of CSHCN ages 1 to 17 had received dental or oral health care in the previous year—higher than estimates for their peers without special health care needs in the state (83%) and for their CSCHN peers throughout the United States (86%).
Areas for action include:
- A smaller share of CSHCN in California (82%) received recent preventive care than CSHCN nationwide (87%). Yet, within the state, CSHCN were more likely than their peers without special health care needs to have received preventive care in the previous year (82% compared with 68%).
- When sick, California CSHCN covered only by public health insurance were more likely to use the emergency room or to have no usual source of care (25%) than those with private insurance only (14%). In California and throughout the nation, privately insured CSHCN are more likely to have a doctor’s office or usual source of care to turn to when ill.
- CSHCN in California had more difficulty getting needed referrals for specialty care than the national average. Nearly 40% of the state’s CSHCN had difficulties getting referrals they needed to see doctors or receive services in the previous year, compared with 31% of CSHCN throughout the nation.
Read about how we can support California CSHCN and their families.
Funding for KidsData’s latest information on CSHCN is provided by the Lucile Packard Foundation for Children’s Health.
KidsData in the News
The Baker Institute’s report Mental Health in High Schools: A Houston Survey cites the KidsData News piece “Hospitalizations for Mental Health Issues Were Rising Before Pandemic.”
Santa Clara County Children’s Data Book [PDF]
KidsData is cited on several topics throughout the 2024 Santa Clara County Children’s Data Book.
U.S. Birthrate Hit New Low in 2023
Deseret News quotes KidsData director Beth Jarosz in an article on declining birth rates in the United States.
Children’s Health Resources
California Kids Wait Months or Years for Specialty Care. Here’s What Would Help
A California Health Report article explores how a shortage of pediatric specialists, coupled with limited numbers of providers who accept some health insurance plans, contributes to barriers to accessing specialty medical care for California’s children—particularly children with disabilities and those from lower-income families.
Researchers at the UCLA Center for Health Policy Research found that 15- to 24-year-olds who said they had access to firearms were twice as likely to have made a suicide attempt than their peers without access to a gun. The study provides insight into the impact of firearm access on the psychological well-being of youth and young adults.
2024 U.S. National Survey on the Mental Health of LGBTQ+ Young People
Among LGBTQ+ young people ages 13 to 24 in United States, 66% have experienced recent symptoms of anxiety, 53% have experienced recent symptoms of depression, and 39% have seriously considered attempting suicide in the past year, according to new data released by The Trevor Project. Overall, more than 5 in 6 LGBTQ+ young people wanted mental health care in the past year; of those, half were not able to get it.
Adolescence Post-Dobbs: A Policy-Driven Research Agenda for Minor Adolescents and Abortion
Youth Reproductive Equity has released its research agenda on abortion policy and its impacts on adolescents under age 18. The report contains a state policy landscape on minors and abortion, principles for conducting equitable and actionable research, and strategies for overcoming challenges that have historically hampered research in this area.
Recently Released Data
We recently released data about access to services for children with special needs; housing affordability and resources; and unemployment. See links to the latest here.
Posted by kidsdata.org
Post Comment
What Expiring Financial Supports, Rising Prices Mean for Child Food Security

Changes in public assistance during the COVID-19 pandemic lifted thousands of Americans out of hunger. Households with children and those receiving food stamps were the main beneficiaries of increased tax credits, funding for social programs, and food assistance.
But in 2022, as such supports expired, food security dropped significantly. Pandemic financial benefits ended, 17 states withdrew from receiving extra support from the Supplemental Nutrition Assistance Program (SNAP), and food prices spiked across the country.
Read PRB’s research highlight.
Explore California strategies to improve children’s food security on KidsData.
Children’s Health Resources
Other Recent Work at PRB
New articles by PRB researchers and partners examine:
- How upcoming changes to race and ethnicity reporting in federal surveys will impact data users.
- Whether, for students from disadvantaged backgrounds, a college degree is worth it.
- Which parental discipline behaviors are associated with positive child development.
State Policy Considerations to Support Equitable Systems of Care for CYSHCN
A new brief by the National Academy for State Health Policy highlights three areas in which states are promoting equitable access to care for children and youth with special health care needs (CYSHCN): data collection, sharing, use, and quality; access to providers and specialists; and supports for family caregivers.
PACEs in California Data Report: CHIS, 2021
The California Essentials for Childhood Initiative and All Children Thrive California have released a new report on positive and adverse childhood experiences (PACEs) among California adults, based on data from the 2021 California Health Interview Survey (CHIS).
Undercounts of Young Children in the 2020 Census
The U.S. Census Bureau has released new estimates of 2020 Census undercounts and overcounts for children ages 0 to 4 at the state and county level. Previously, the Census Bureau estimated that, nationally, young children were undercounted by 5.4% in the 2020 Census. California’s undercount rate, 7.8%, was among the highest of any state in the nation.
Posted by kidsdata.org
Post Comment
Spotlight on Children With Special Needs (Part 2): Who Are California’s Children With Special Health Care Needs?

The second in our series on children with special health care needs (CSHCN) explores key demographic and health characteristics of CSHCN in California. Read the first in our series, on access to family-centered care for CSHCN families, here.
In 2022, an estimated 16% of California children ages 17 and under had special health care needs. This means that nearly 1.4 million of the state’s youngest residents had or were at increased risk for a chronic physical, developmental, behavioral, or emotional condition and required related services beyond what’s required by children generally. The ongoing health challenges facing children with special health care needs (CSHCN) can affect their ability to function and participate in important educational and social activities; in some cases, the challenges can shorten their lives.
What do existing data tell us about these children? Here are five things you should know about California’s CSHCN:
1. CSHCN are more likely to have multiple adverse childhood experiences than their peers. The share of CSHCN in California who have experienced four or more adverse childhood experiences (ACEs) is more than five times that of children without special health care needs. These experiences can disrupt healthy development and lead to behavioral, emotional, academic, and health problems throughout life. The more traumatic childhood events experienced, the more likely the impact will be substantial and long lasting, especially if the child does not receive the right support in the aftermath.
2. Parents of CSHCN are less likely to report that their children are resilient when faced with challenges. Resilience may help mitigate the harmful effects of ACEs and toxic stress in children. But just under half of CSHCN in California were described by their parents as resilient—meaning they usually or always stay calm and in control when faced with challenges—compared to 80% of children without special health care needs.
3. Mental health conditions are more common among CSHCN. According to 2022 data from the National Survey of Children’s Health, 51% of California CSHCN ages 3 to 17 had one or more diagnosed mental health conditions—attention deficit disorder or attention-deficit/hyperactivity disorder, anxiety problems, behavioral or conduct problems, or depression—compared with just over 5% of their peers without special health care needs.
4. Most CSHCN have complex health care needs, including multiple chronic conditions, requiring in-depth services and treatment. In California, over three-quarters (77%) of CSHCN had complex health care needs in 2022, with 65% having more than one chronic condition and 27% having more than three.
5. While the share of CSHCN in middle- and higher-income families is above the national average, racial and ethnic disparities exist. Nearly one-third of CSHCN in California had a 2021 family income of at least 400% of the poverty threshold (i.e., $109,916 for a family of two adults and two children), compared with just over one-quarter of CSHCN nationally. Yet just one-fifth of Hispanic or Latino children, who comprise about half of the state’s CSHCN, live in families with this income level, and Hispanic or Latino CSHCN are more likely to live just above the poverty threshold than in other income brackets. On the other hand, while white children comprise less than one-third of the state’s CSHCN, more than half of them live in families with incomes at or above 400% of the poverty threshold.
Read about how we can support California CSHCN and their families.
Funding for KidsData’s latest information on CSHCN is provided by the Lucile Packard Foundation for Children’s Health.
We Want to Hear From You
Closing Tomorrow: KidsData User Survey 2024
How do you use KidsData data and resources? What could we do differently? We want to hear from you about how we can improve our offerings to better support your efforts on behalf of children and families. Please consider taking 10 minutes to share your thoughts in our user survey. The survey closes this Friday, March 29.
Opportunity
2024 Santa Clara County Children’s Summit
The Santa Clara County Children’s Summit, presented by Kids in Common on April 19 from 9:30 a.m. to 3:30 p.m. PDT, gathers cross-sector and young leaders to connect and collaborate in improving the well-being of the county’s children. This year’s theme, “Cultivating Caring Communities,” marks the launch of initiatives aimed at boosting the social-emotional health of children, youth, and families, offering attendees the opportunity to learn from experts and strategize on advancing this critical aspect within their communities. Register here.
Children’s Health Resource
Measuring Student Safety: New Data on Bullying Rates at School
About 19% of students in the United States reported being bullied during the 2021–22 school year. A new release by the National Center for Education Statistics uses data from the School Crime Supplement to the National Crime Victimization Survey to highlight recent bullying victimization in U.S. schools.
Recently Released
We recently released data about characteristics of children with special health care needs. See links to the latest here.
Posted by kidsdata.org
Post Comment