Data Questions: Data for Rural Communities
 This week, we’ll be showing kidsdata.org at the California Rural Health Conference in Sacramento.
When visiting rural communities, we often get questions about why so little data are available. In this installment of Data Questions, we’ll address this issue:
“I live in a rural county — why does kidsdata sometimes show LNE instead of data for my region?”
LNE stands for Low Number Event. LNE is defined differently depending on the data source, but is shown when the numbers are too small to report. Showing LNEs helps us maintain statistical integrity and, in some cases, it helps ensure the anonymity of the children reporting the data. Whenever you see an LNE in a graph or chart, its definition is explained in the “footnote” below the data. On maps, regions with LNEs appear as white.
We know that in many cases, rural communities with small populations of children need to gather the same data as urban communities, but are burdened with a smaller pool of data available. We try to address that need in several ways. In some cases, we aggregate data across several years. In other cases, we offer data for regions made up of several counties with small populations. When possible, we aim to offer numbers alongside rates and percentages, so that even if there are not enough English Learners in a school district to report a reliable percentage, we can offer the number of English Learners.
A quick way to find out what data are available for your region is to go to the Data by Region page, select your region, and then click “View all data” at the top of the page.
Posted by Sarah Marxer and Felicity Simmons
Post Comment
Questions From Mendocino That May Help You, Too
 Recently, we traveled up to Ukiah, CA, to provide an introduction to kidsdata.org for a group of key people working on behalf of children’s health in Mendocino County. The group participants asked several good questions about kidsdata.org and the data available on the site. Their questions, and our answers, are below.
Question: When viewing survey data, is there a way to find out the sample size?
Answer: In most cases, you will need to go to our data source, (a link to the source is found in the Data Source field below every table or graph) to learn the sample size of the survey. For example, you can find the number of students taking the California Healthy Kids Survey by selecting one of the reports on this page: http://chks.wested.org/reports/search. You can find information on the California Health Interview Survey sample sizes here: http://www.chis.ucla.edu/who-chis.html. The American Community Survey gives information about sample sizes here: http://www.census.gov/acs/www/methodology/sample_size_and_data_quality/ In general, we don’t report out small numbers from surveys. Those are reported as a Low Number Event, or LNE, in the graph.
Question: If the same data come from two different sources, how do you decide which to include on the site?
Answer: Our criteria include data quality, the consistent availability of data over time and across counties, and ease of accessing the data. We welcome feedback about our choices.
Question: Is it possible to compare multiple topics at once for your county, or compare your county to other counties, to see where there are outliers?
Answer: In early 2011 , we are aiming to launch a tool that will allow users to compare multiple regions and multiple topics in one table view. We’re adding it for the exact reason you mention — to offer the ability to quickly view outliers.
Question: Can you group similar counties together — by size, for example — without already knowing which counties are similar?
Answer: When displaying data results, we are exploring the possibility of grouping counties regionally, so that counties physically near each other are grouped together. We also could consider grouping according to population or economic make-up. We welcome your suggestions on groupings that would be useful for you.
Posted by kidsdata.org
Post Comment
Get Out and Vote — for Kids
 You already know that Tuesday, Nov. 2 is election day.
But what you may not know is that there are a number of issues on the ballot this year affecting kids. Issues such as funding for community colleges and school districts, health insurance for low-income kids, and public safety are on the ballot. The people we elect at all levels of government, from senator to governor to state superintendent of schools to local council members, will decide on wide-ranging policies affecting kids.
Whatever your politics, please keep kids in mind when you go to the polls on Tuesday.
Need some data on issues affecting kids? Visit kidsdata.org for data on child safety, education, health care, and many other issues.
Posted by kidsdata.org
2 Comments
Sac Bee Editorial Says Kids Not on Candidates’ Radar Screen
An editorial in today’s Sacramento Bee laments that the two candidates for governor are not talking more about issues affecting kids in California. “Neither [candidate] has anything resembling an agenda for children, and what they do have to say is vastly unsatisfying,” says the editorial, also noting our foundation’s interest in encouraging a dialogue on issues related to children’s health and well being.
The editorial enumerates a range of issues that the candidates could comment on, citing data. For those interested in how children are faring on the measures highlighted by the Sacramento Bee’s editorial, here are links to currently available data:
Posted by Andy Krackov
Tags: Child Health Issues
Domestic Violence is a Child Health Issue
October marks Domestic Violence Awareness Month, an issue affecting children and families nationwide.
Although domestic violence often occurs between adults, it concerns children because in 30% to 60% of families that experience domestic violence, children also are abused. In addition, children who witness domestic violence — even if they are not targets of the violence — tend to exhibit the same emotional, behavioral, and academic problems as abused children.
In California, rates of domestic violence calls for assistance decreased by nearly one third from 1998 to 2008. In one county – Merced – severity has gone up even as rates were stable.
View a customizable map of domestic violence rates by county >>
On kidsdata.org, we also offer an important related measure of violence – dating violence among adolescents. These data come to us from the California Healthy Kids Survey, which is administered in schools statewide by WestEd for the California Department of Education. According to the ’06-’08 survey, 6.6% of 11th-grade girls and 7.5% of boys reported they had experienced dating violence, defined as being hit, slapped, punched, or otherwise hurt by a boyfriend/girlfriend in the past year.
Across all grades in California, boys are more likely than girls to report dating violence, except in non-traditional school settings. And the percentage of 11th-grade boys reporting dating violence has increased in recent years. Students who report high levels of connectedness to school are less likely to report dating violence.
Posted by kidsdata.org
Tags: Health Observances
What Data Would You Like to See on Kidsdata.org?
 |
| Want to know when data of interest to you are updated? Sign up for e-alerts to get data updates tailored to your interests that are sent weekly or monthly. |
Just a year ago, kidsdata.org expanded from the Bay Area to include wide-ranging data on children’s health and well being for every city, school district, and county in California.
We’re continually updating the hundreds of measures that are available through kidsdata.org (see an A to Z list of available data), and enhancing the site to make it even easier to find, interpret, and share data.
Over the next year, we’ll be adding data on these topics, among others:
- Poverty
- Preterm Births
- Obesity
- Environmental Health (air and water quality, lead poisoning, etc.)
- Truancies, Suspensions, and Expulsions
- Youth Not Working and Not in School
See the Full List of New Indicators We’re Adding to Kidsdata.org >>
In addition to what we’re adding and what’s now available, what other measures would you like us to consider offering through kidsdata.org? If you know of data sources for what you’re suggesting, that would help too.
Posted by kidsdata.org
Tags: News About Kidsdata.org
California Data Sheds Light on Bullying of Gay Youth
October is National Bullying Prevention Month, and a recent bullying-related suicide by a New Jersey college student is a tragic reminder of how devastating bullying can be.
Several recent bullying victims making national headlines were children and young adults bullied due to their sexual orientation. In fact, there has been so much outcry that a YouTube campaign has started to support the victims.
Kidsdata.org offers data on this subject.
Kidsdata.org has student-reported data from the California Healthy Kids Survey noting how many times students in 7th, 9th and 11th grades, and in non-traditional programs, report being bullied due to their sexual orientation. These data are available for counties and school districts across California, and also are broken out by race/ethnicity and level of connectedness to school.
According to the 06-08 data, more than 5 percent of 7th-grade boys in California reported being bullied four times or more in the past year because they were gay or because someone thought they were gay; 2.5 percent of 7th-grade girls said the same. Overall, 10 percent of 7th-grade girls and 12 percent of boys report being bullied at least once in the past year due to sexual orientation.
We also offer data about bullying reports for other reasons. Bullying and Harassment due to:
Posted by Felicity Simmons
Tags: Child Health Issues
‘Distress Index’ Measures Recession’s Impact on Local Families
 Just how bad is this recession — and how is it affecting families in high cost-of-living areas like the Bay Area? A new ‘Distress Index’ can shed some light.
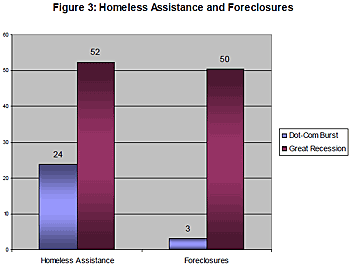
The Stanford Center for the Study of Poverty and Inequality, in partnership with New America Media and the San Francisco Foundation, just released “Measuring Economic Distress in San Francisco,” an index that monitors 11 indicators of distress, including bankruptcies, CalWORKs enrollments, foreclosures, unemployment, food bank pantry visits, and other measures where data are updated more frequently than on an annual basis.
The index assesses San Francisco’s distress for the last 10 years — primarily comparing the dot-com bust to the recent recession. Although the index is limited to the city/county of San Francisco, researchers noted that they hope other communities will replicate the idea.
Overall, researchers found that the distress index in San Francisco has been increasing since 2000. It also notes that foreclosures, food stamps applications, and homeless assistance are all higher during this recession than they were during the dot-com bust. For all results, visit http://www.stanford.edu/group/scspi/_media/pdf/cpr_papers/San_Francisco_Distress_Index.pdf
Interested in data about family economics for your community? We have several indicators on kidsdata.org.
Posted by Felicity Simmons
Tags: Data Projects
Partnership with CHKS Provides Easy Access to Depression, Bullying and Other Key Datasets
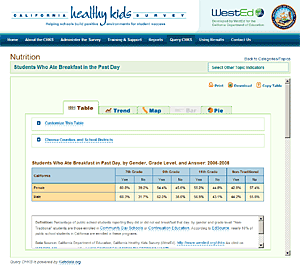
 Finding timely measures of critical issues such as teenage depression, bullying, and drug use can be quite challenging. Fortunately, here in California, we have a rich database of self-reported information for these and other behavioral/emotional health topics through the California Healthy Kids Survey (CHKS). Thanks to a partnership with WestEd, which administers the survey, and the California Department of Education, kidsdata.org offers more than 80 indicators from CHKS – all available at the school district level. This month, we’re extending that partnership, with WestEd’s announcement of the launch of its new website, Query CHKS, which allows users to view and customize data from CHKS directly from WestEd’s own site.
Query CHKS combines the wealth of valuable data from the survey with the data display of kidsdata.org, allowing for easy access to the millions of data points available through CHKS. Many of the tools available on kidsdata.org now are available on Query CHKS, including the ability to view data as trend or bar graphs, maps, pie charts, and tables; as well as the options to download or copy those data.
And, as the data are updated on kidsdata.org, they will automatically be updated on QueryCHKS.
You can add a graph from kidsdata.org to your website, too. Simply find the data you’re interested in, customize the chart with your preferences, and click “embed” in the top right.
Posted by kidsdata.org
Tags: Data Projects, Data Sources, News About Kidsdata.org
Kidsdata.org Answers Your Data Questions: The Crosstab Quandary
Here at kidsdata.org, our staff has been traveling throughout California to introduce this resource to people who work on behalf of children. In all of these meetings, we get excellent questions about the availability and limitationsof the data on our site. We thought we’d share some of those questions — and our answers — with you in a series of blog posts. If you have a question, feel free to post it as a comment here, or on our Data Questions page.
Today’s Question: There are so many topics of data available on kidsdata.org. Can I put together two different indicators to learn more about the population of children I serve? For example, can I combine your data on children in poverty and your data on asthma diagnoses to learn about the relationship between poverty and asthma?
Answer: Alas, the short answer to this question is no.
You cannot use kidsdata to run crosstabs, as they’re called, when data come from different sources, because the data were collected from different sets of children. For example, the asthma diagnosis data on kidsdata.org come from the California Health Interview Survey, and data about children in poverty come from the American Community Survey. That means that we can’t use those two datasets to explore whether children living in poverty are more or less likely to be diagnosed with asthma. To do that, we’d need a single source that recorded a child’s family income level and whether or not the child had asthma.
However, within an individual source of data, we often offer multiple breakdowns for a given indicator. For example, on kidsdata.org we offer dozens of measures of child and youth well being health from the California Healthy Kids Survey. Because the same students answered all the questions on that survey, it’s acceptable to compare the responses for different topics. You can explore how different risk behaviors (like drinking alcohol) vary by students’ level of connection to school, or by gender and grade level. For any indicator, if there are other breakdowns that you think we should add, we certainly would like to know; add a comment below.
Soon on kidsdata.org, we’ll be offering the ability to compare multiple indicators for multiple regions, so that it’s easy to get a summary of how children are faring on a range of issues, across regions.
Posted by Sarah Marxer and Felicity Simmons
Tags: Data Challenges, Data Sources


