CA’s Youth Suicide Rate Has Declined: A Summary of Data
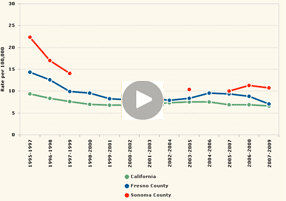 Data just posted to kidsdata.org show that California’s youth suicide rate declined to its lowest level in more than 10 years. The rate, which was 6.6 suicides in ’07-’09 per 100,000 youth ages 15-24, was about 30% lower than the rate of 9.4 in ’95-’97. In case you missed our recent advisory, view this slideshow for a summary of key data findings on suicide and self-inflicted injuries.
Posted by kidsdata.org
Post Comment
November is National Adoption Month
National Adoption Month helps raise awareness about the thousands of children and youth nationwide in the child-welfare system who are awaiting permanent families.
Data show that there were 58,012 children in foster care in California in 2010. And, according to 2009 data, 72% of California’s foster children waited 2 or more years to be adopted into a permanent home.
See more data on foster care children in California>>
See a related Data Points blog post on “Helping Adopted Children Overcome Adversity“
Posted by kidsdata.org
2 Comments
‘Growing Up Poor in the Bay Area’ Forum Comes to Silicon Valley
New America Media is partnering once again with the Lucile Packard Foundation for Children’s Health to join the latest data on child health with local youth perspectives, in order to tell on-the-ground stories about what it’s like Growing Up Poor in the Bay Area.
This forum, which will be held on Thursday, Nov. 3, from 10:30 a.m. to 1 p.m. in San Jose, will feature information about youth poverty from several perspectives:
- A presentation of local poverty data on kidsdata.org;
- Multimedia stories from youth reporters who will translate these data into real lives, describing how they’ve seen poverty affect local youth; and
- Comments/discussion from youth development organizations and others about troubling trends and recommendations for action.
We hope that this forum will help illustrate challenges faced by low income youth and families — and perhaps inspire some media coverage of these issues. Stay tuned to Data Points for a re-cap of this event.
If you’d like to attend Thursday’s event, RSVP to Liz Gonzalez at [email protected] or at (415) 503-4170.
See our Recap and Video from our last New America Media Forum event in San Francisco.
Posted by kidsdata.org
Post Comment
How to Use Kidsdata.org to Map Data for Your Legislative District
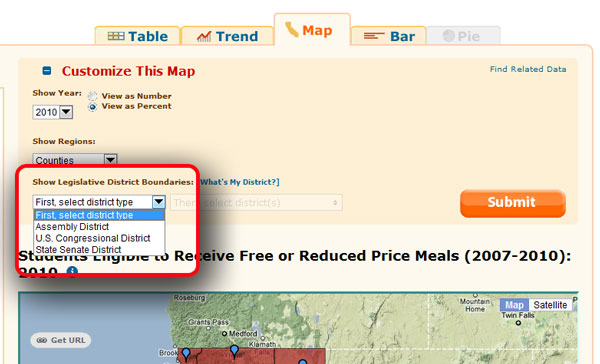
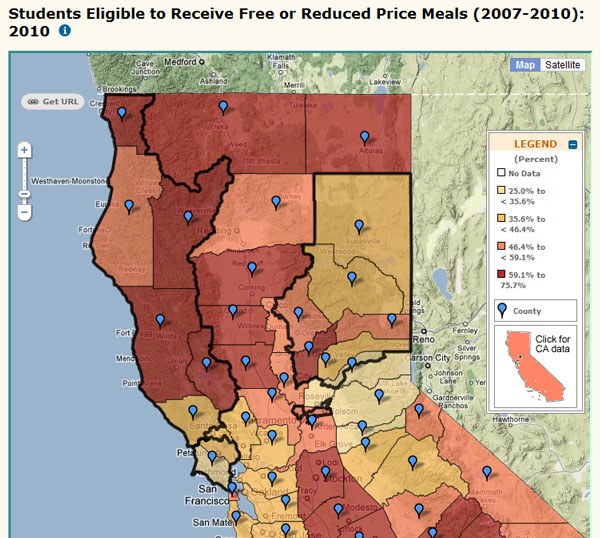
We’ve added a new legislative district overlay tool to maps on kidsdata.org. This tool allows you to see the data you care about, and then overlay legislative district boundaries, to help visualize what’s happening in your district.
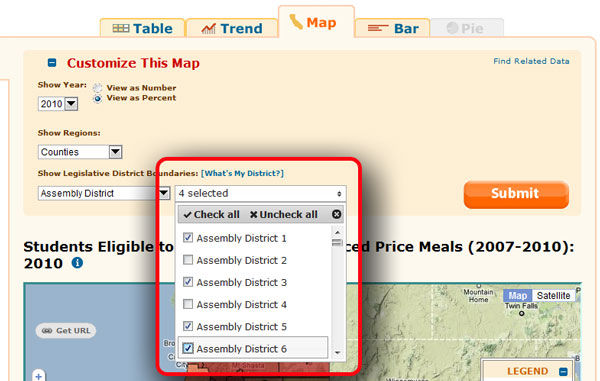
How to Overlay Legislative District Boundaries:
1. Find data of your interest on any kidsdata indicator page. Next, select the map tab, and click the “Customize This Map” bar.
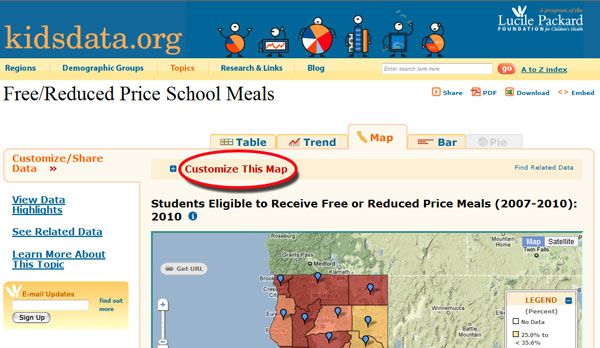
2. Next, select your district type (Assembly, State Senate, or U.S. Congressional districts) under “Show Legislative District Boundaries.”
3. Then, select the districts you’d like to see on the map. You can select as many districts as you want, or, click “Check All” to view all districts.
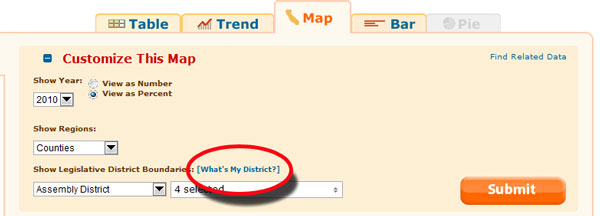
4. Don’t know your district? Hit the “What’s My District?” link. When you’re finished customizing, click the big orange “Submit” button to build your legislative data map.
5. Print your map and take it with you to advocacy or policy meetings.
Posted by Jordan Handcox
Post Comment
Poverty on the Increase in Suburban Areas, Data Show
A recent analysis of Census data by the Brookings Institution has found a significant increase in the number of suburban households living in poverty.
According to a New York Times article about the analysis, poor populations in suburbs have grown by more than half since 2000. These areas have been hit hard by foreclosures and unemployment, the article notes, and can’t support residents who need the kinds of public services typically only available in urban areas.
On kidsdata.org, we offer poverty data for California school districts, cities and legislative districts, as well as data about students eligible for free/reduced price school meals, which is a proxy measure of poverty. These data encompass all regions in California – urban, suburban, and rural. Additionally, kidsdata.org includes several demographic measures of children in suburban areas, including:
- Child Population
- Households with and without Children
- Family Structure
- Children in the Care of Grandparents
- Foreign-Born Children
You also can find a broader summary of data available for your community by choosing a region here.
Posted by kidsdata.org
1 Comment
A Round-Up of Recent News About Child Health: Drug Use, Special Needs, Homelessness, and More
Here’s a summary of some recent news articles about child health issues, along with related data available on kidsdata.org:
Alcohol, Tobacco, and Other Drug Use (See related data)
- Drugged Driving Takes High Toll Among Youth, Report Finds
(CBS News, 10/13/11, by Freeman)
Children with Special Health Care Needs (See related data)
- Non-Invasive Early Pregnancy Test for Down Syndrome Now Available in 20 Cities Nationwide
(LA Times, 10/19/11, by Roan) - Low Birthweight Infants at Increased Risk for Autism, Study Finds
(USA Today, 10/17/11)
Homelessness (See related data)
- Report: Youth Homelessness on the Rise in Richmond
(Richmond Pulse, 10/14/11, by Croom)
Infant Mortality (See related data)
- Article Explores Efforts to Reduce High Infant Mortality Rates Among Black Mothers
(NY Times, 10/14/11, by Williams)
- California’s Infant Mortality Rate Dips to New Low
(Healthycal.org, 10/21/11)
Teen Births (See related data)
- Study: National Teen Pregnancy Rate Drops; Contraceptive Use Up Among Boys
(MSNBC, 10/12/11, by Alexander)
Posted by kidsdata.org
Tags: Child Health Issues
Celebrate 30 Years of Down Syndrome Awareness
October is Down Syndrome Awareness Month, a health observance sponsored by the National Down Syndrome Society.
This year’s observance celebrates 30 years of public awareness efforts by both highlighting the diverse accomplishments of individuals with Down syndrome and challenging stereotypes.
In California, about 1% of children with special health care needs have Down syndrome, according to ’05-’06 data.
See other data about children with special health care needs >>
Posted by kidsdata.org
Tags: CSHCN
New Report Warns Against Screen Time for Young Children
 A report released this week by the American Academy of Pediatrics (AAP) indicates that “media—both foreground and background—have potentially negative effects and no known positive effects for children younger than 2 years” (p. 4).
And it’s not just television that’s at issue. According to this New York Times article, the AAP recommends limiting screen time of all types — computers, electronic games, and televisions turned on for background noise — recognizing that screen time can reduce opportunities for educational and enriching activities that are important for healthy development. The AAP recommendation actually is less restrictive than its previous policy, in an attempt to be realistic about screen use in today’s households. Some research shows that between 40 and 60 percent of American households report having a TV on for much of the day, the article notes.
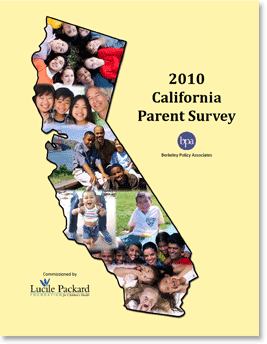
Here in California, our foundation’s 2010 Parent Survey (at right) asked about parental perceptions of media use on children. Parents of more than half of children, 57%, believed that media (TV, movies, music) had a positive impact on their children, whereas parents of 24% thought the media had a negative effect. Teens ages 14‐17 were more likely to have parents who thought media had a negative effect than young children ages 0‐5 (33% vs. 10%, respectively).
For more research and information about the influence of media on children, see kidsdata.org’s Research & Links section.
Posted by kidsdata.org
Tags: Child Health Issues
Kidsdata.org — Don’t Keep It a Secret
| Get customized e-alerts | |
| Join the conversation | |
| Find a fact of the day |
If you’re reading this blog post, then you already know and like (or perhaps love) kidsdata.org.
Shouldn’t everyone?
After all, kidsdata.org offers free access to hundreds of measures of local child well-being from dozens of reputable data sources. You can find children’s data by age or racial/ethnic group, among other breakdowns, as well as for every city, county, school district, and legislative district in California. The site is an invaluable resource for grant writing, policy making, strategic planning, community assessments, and a host of other important work on behalf of children statewide.
While Kidsdata.org offers easy access to millions of data points we also offer several ways of delivering these data directly to you. Please help spread the word about kidsdata.org by encouraging your friends and colleagues to follow the three steps below. Together, we can ensure that anyone working on behalf of children in California has access to the data they need to improve children’s lives.
1. Sign up for a customized e-mail alert, and we’ll send you an e-mail any time data of interest to you are updated.
2. Follow us on Twitter, where we’re tweeting a daily fact about California kids, as well as timely news and information related to child health issues.
3. ‘Like’ us on Facebook, and share your insights about the data on kidsdata.org and the work you’re doing on behalf of children.
Posted by Felicity Simmons
Post Comment
October is Domestic Violence Awareness Month
Domestic violence is an increasingly prevalent issue for California youth. According to the U.S. Department of Health and Human Services, in 30 percent to 60 percent of families that experience domestic violence, children also are abused (some estimates of this co-occurrence are even higher).
Additionally, children who witness domestic violence — even if they are not targets of the violence — tend to exhibit the same emotional, behavioral, and academic problems as abused children. Children raised in violent family environments also are at risk of becoming abusers or victims themselves during adolescence or adulthood.
Here in California, about 7% of 11th graders report dating violence, meaning they had been hit, slapped, punched, or otherwise hurt by a boyfriend/girlfriend in the past year, according to 2006-08 data.
See the reported percentage of youth dating violence for your county or school district >>
There were also a total of 166,343 calls for domestic violence related assistance in California in 2008.
Learn more about dating and domestic violence in California >>
Posted by kidsdata.org
Tags: Child Health Issues, Health Observances


