Guest Post: Helping Adopted Children Overcome Adversity
 This guest post was written by Sarah Marxer, kidsdata.org’s former data manager, and also is posted on KQED’s Perspectives page.
As an adoptive mother, I had a complicated reaction to this year’s federal report on the status of children, which has a special focus on adopted children. Its most striking finding is that while just 12 percent of all children have a physical or mental health problem, that figure is 29 percent for adopted children in general and 45 percent for children who, like my child, were in foster care before their adoption.
Despite my worry that sharing this information will stigmatize adopted kids, I want to make sure that we don’t miss this chance to learn something important about the ways that intensely stressful conditions early in life affect children. This report ought to raise alarm about the ways our tolerance for poverty harms the life chances of too many kids — most of whom are not adopted.
Researchers are learning that abuse, neglect and other forms of trauma during childhood — including poverty and exposure to community violence — affect many aspects of health throughout life. The findings about the compromised health of adopted children bear this out.
Today, the majority of domestically and internationally adopted kids, particularly those who have been in foster care, have endured things that hurt their chances for healthy development — including deprivation, abuse and disrupted relationships. Most adopted children thrive, but a substantial minority has significant emotional, physical or developmental problems. The ones most likely to struggle are those who experienced the greatest stresses in their early years.
With adequate resources, even children who’ve had a hard start in life can flourish. These insights should spur us to make it a priority that vulnerable children and their families — adoptive or not — get the help they need, and to reorder our priorities so that families don’t have to raise their kids in unsafe and chronically stressful conditions.
See data on kidsdata.org about children adopted from foster care.
Posted by kidsdata.org
Post Comment
Upgrades to Kidsdata.org Help You Take Data Everywhere
Good news – we have embraced new mapping technology here at kidsdata.org. Our maps now are compatible with iPhones/iPads and other devices that are not flash-friendly. At your next meeting, you can pull up the facts you need from kidsdata on your iPad or other mobile device.
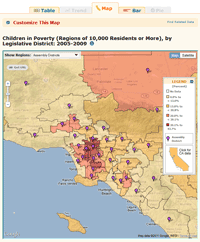
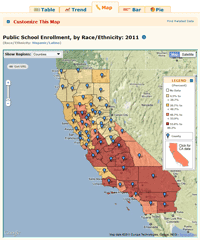
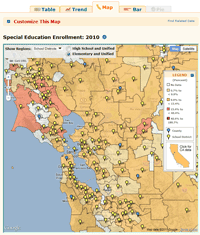
Our maps now are not only compatible with these devices, but also printer-friendly. These full color, compelling maps make interesting handouts or packet inserts (and they are free, like everything on kidsdata.org). Simply navigate to any map of interest and use your browser’s “Print” function to get a printout of the map. See below for a few examples of the different types of maps on kidsdata.org.
| Visiting your legislator? Take along a map of child poverty in your district. |
Print this map of Latino student enrollment in CA public schools. |
Make a case for special education in your school district with customized handouts. |
 |
 |
 |
Posted by Jordan Handcox
Post Comment
This Week is National Primary Care Week
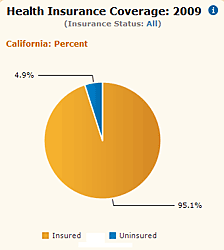 This health observance began in 1994 in response to a shortage of primary care physicians. The goal is to bring awareness to the health care field of the interdisciplinary and comprehensive practice that primary care has to offer.
This year’s observance celebrates Innovations in Primary Care.
Find a participating location for National Primary Care Week: http://primarycareprogress.org/programs/npcw.
Kidsdata.org offers data on several aspects of primary care for children, including health insurance, school health centers, and medical homes.
Posted by kidsdata.org
Tags: Health Observances
Second Chance to Attend a Southern California Workshop on Using Data in Your Work
Recently, in partnership with the HealthDATA program at the UCLA Center for Health Policy Research, we offered a day-long workshop about finding and using child health data.
Now, we’re pleased to be offering a second workshop, this time in Colton on Friday, Oct. 14.
At this FREE workshop, you’ll learn how to formulate data questions, interpret results, export data for analysis, and use your findings in reports, presentations, proposals, and policy/program planning. Working directly with kidsdata.org, attendees will learn simple tips for obtaining health information for every city, legislative district, county, and school district in the state.
For more information, or to register, visit http://www.kidsdata.org/content/ucla-inland/Default.aspx.
Posted by kidsdata.org
Post Comment
National School Lunch Week: A Focus on Healthful Eating
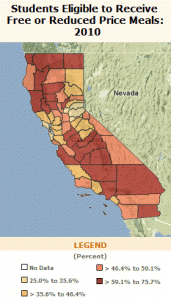 This week is National School Lunch Week, supported by the National Education Association and the School Nutrition Association. This national health observance offers an opportunity to focus on making school-provided lunches as healthy as possible.
For this year’s theme — “School Lunch- Let’s Grow Healthy” — schools are encouraged to follow a program to educate kids about locally grown produce and the benefit of eating lunch, in order to grow up strong and healthy.
Kidsdata.org includes data on eligibility in the Federal Free/Reduced Price School Meal Program. These data, from the California Department of Education, are available for counties and school districts.
In 2010, more than 3.4 million California public school students (56%) were eligible to receive free/reduced price meals. And, in nearly every county in California, that percentage increased from 2008-2010. See more local breakdowns>>
What’s happening in your school district? Visit kidsdata.org to find out>>
Posted by kidsdata.org
Tags: Health Observances
California Governor Signs Several Bills Affecting Children into Law
 Governor Jerry Brown signed into law several bills affecting child health and well being before the constitutional deadline at midnight last night, including:
- SB 946 Health care coverage: pervasive developmental disorder or autism. This bill, introduced by Senators Steinberg and Evans, will require private health care service plans and health insurers to provide coverage for behavioral health treatment for persons with autism spectrum and certain other related pervasive developmental disorders. (see data on autism)
- AB 1088 State agencies: collection of demographic data. This bill, introduced by Assembly Member Eng, will require the Department of Industrial Relations and the Department of Fair Employment and Housing to collect demographic data on additional Asian and Pacific Islander groups. See a previous Data Points blog post, “How Can We Better Measure California’s Child Diversity?” for a related discussion. Related data also are available on kidsdata.org.
- AB 1156 Pupils: bullying. This bill, introduced by Assembly Member Eng, encourages the inclusion of policies and procedures aimed at the prevention of bullying in comprehensive school safety plans. (see data on bullying)
- SB 746 Tanning facilities. This bill, introduced by Senator Lieu, will prohibit minors from using tanning beds. (see data about California teens)
Posted by Jordan Handcox
Post Comment
What Are Some Children’s Data Needs in Los Angeles County?
 On a recent trip to Los Angeles, we had an opportunity to hold a roundtable discussion with deputies from various county departments.
The topic of discussion? Data, of course. And, more specifically, how our foundation and kidsdata.org might be able to help with any gaps or needs regarding child health data in the county. We weren’t just talking about topics of data that are needed — that list surely would be infinite. We also spent the time sharing ideas about how data use might be better facilitated. The attendees — representing county departments such as juvenile justice, social services, public health, maternal and child health, and more — noted a number of key areas:
- Integrating public assistance data: It would be helpful, for example, if we knew how many students who drop out of high school are also on some form of public assistance.
- Sharing data across county departments: Some attendees suggested finding a central place to offer the county departments’ state-mandated reports for public consumption.
- Offering data at a more local level: This is a common refrain we hear when meeting with people in Los Angeles. We don’t currently offer data on kidsdata.org more locally than by city or school district, but we’re open to considering the possibility of even more local data. (Read our blog post about The Quest for Local Data)
- Data for transitional-age youth: Across many departments, these data are valuable — for homeless youth, youth with disabilities, and youth in foster care.
We’ll give these good ideas consideration, and see what may align with our statewide work with kidsdata.org. And if you are from Los Angeles, let us know via a comment what additional priorities you would you recommend we consider. Stay tuned to this blog for updates on our ongoing work to meet children’s data needs in Los Angeles County and statewide.
Posted by Felicity Simmons
Tags: Data Challenges
Help Shape Kidsdata’s Future
We meet with people all over California, introducing them to kidsdata.org. In nearly all of those meetings, we hear this common question: WHO uses kidsdata?
Because we can all use kidsdata.org anonymously, that is a difficult question to answer. So, we’ve decided to ask you, the users. We’re not out to gather any personal information — we’d just like to know two quick things: your primary affiliation, and how you plan to use the information you find on kidsdata.
Your response will be extremely valuable, and will help us shape the future content and enhancements on kidsdata.org.
Take the poll>>
Posted by Felicity Simmons
Post Comment
Turning Data Into Action
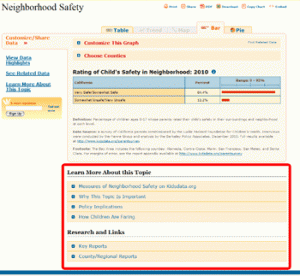 Back in May, we told you about an upcoming feature on kidsdata.org that aims to help policymakers tackle the important issues revealed in the data — a new Policy Implications section.
Now, this section is available for topics across kidsdata.org. (See an example) These narratives describe promising and research-based policy and program ideas, conveying the message that problems shown in the data can be addressed.
You can find the new Policy Implications section below tables, graphs or maps on kidsdata.org, or by clicking on “Learn More About This Topic” after finding your topic here. For more information, read our recent e-mail advisory about this new feature>>
We also recently revamped kidsdata.org’s Research & Links section, which offers key websites, additional research, and reports related to each topic. Learn more>>
Posted by Felicity Simmons
Tags: New Features
What Does It Cost to Meet Basic Needs?
At a time when unemployment is high and poverty is a pressing issue, new data show that the cost of making ends meet has increased.
New self-sufficiency data, released today by the Insight Center for Economic Development and available now on kidsdata.org, show how much income is required to meet basic needs. On kidsdata.org, we show the self-sufficiency standard for three family types: two adults and an infant, two adults and a school-aged child, and two adults and a teenager. The standard assumes that both adults work full time, and shows what they need to make in order to cover costs for housing, food, child care, out-of-pocket medical expenses, transportation, and other necessary spending.
In many California counties, the cost of meeting basic needs increased from 2008 to 2011. The Insight Center reports the reason for this increase is a combination of the rising cost of health care, child care, and taxes. See the center’s data on all family types.
For households with two adults and one infant in Alameda County, the cost of living increased by more than $8,000 between 2008 and 2011. In other Bay Area counties the increase was even greater — Santa Clara County saw an increase of nearly $14,000. In Southern California, Los Angeles County households of this type saw an increase of more than $9,000 between 2008 and 2011. Other Southern California counties such as Orange, Riverside, and San Bernardino saw more modest increases.
Among households with two adults and one school-aged child, every county had an increase in the cost of living — especially Santa Clara County, which had an increase of nearly $10,000. For households with two adults and a teenager, most counties experienced an increase in the cost of living between 2008 and 2011, but for 12 counties (i.e., Colusa, Glenn, Imperial, Kings, Madera, Merced, San Bernardino, Santa Barbara, Tehama, Tulare, Yolo, and Yuba), the cost of living decreased.
Find the cost of living in your county>>
Note: The Self-Sufficiency Standard data come from the Insight Center for Community Economic Development and Dr. Diana Pearce, Center for Women’s Welfare, School of Social Work, University of Washington. For more information, see http://www.selfsufficiencystandard.org/pubs.html.
Posted by Felicity Simmons
Tags: New Data


