

Kidsdata.org Named a Health Data Consortium All-Star!
![]()
Kidsdata.org is honored to be named one of the Health Data Consortium’s All-Stars!
The Health Data Consortium is a nonprofit collaborative of government, non-profit, and for-profit organizations that works to make data more available to the public to improve American health care.
The folks at Health Data Consortium liked how easy kidsdata.org is to use and how indicators can be visualized in different ways. Kidsdata.org was created by the nonpartisan Lucile Packard Foundation for Children’s Health to promote the health and well being of California’s kids. Data are available for every city, county, and school district in California, organized by topic, region and demographic group. Leaders working on behalf of children use kidsdata.org to assess community needs, set priorities, track progress, make program and policy decisions, and identify challenges still to be met.
In the spirit of sharing, here are some other child data All-Stars named by the Health Data Consortium:
Data Resource Center for Child and Adolescent Health
The Data Resource Center provides free data sets for the National Surveys of Children’s Health and National Surveys of Children with Special Health Care Needs. They provide national and state-level data on child health factors and indicators from these surveys so that the public can stay well-informed about issues prevalent in child health.
Kids Count
Kids Count uses data supplied by the Annie E. Casey Foundation to offer hundreds of measures of children well-being from education to demographics to health factors. You have to option of searching for data by state or by topic. Information is organized in rankings, charts, maps, and line graphs and is easily customizable by years, race, and data type. Its user-friendly interface makes it very easy to use, and the range in topics Kinds Count covers is immense.
Child Trends
Child Trends Databank allows you to see their research on various topics such as child welfare, education, indicators, and parenting. They track and analyze trends, identify evidence-based programs and services, and providing data-driven guidance on policies and practices regarding children. Their goal is to help public policy makers see what programs do and don’t work to enhance children’s development.
Posted by Amy Lam
Post Comment
What Pediatricians Can Learn from Retail-Based Clinics

Once upon a time, health care for children was provided by a physician in a medical office at a scheduled time, and the cost of the services was not discussed with the doctor. Today, a family may drop in without an appointment to a clinic located in a shopping center, and scan a price list posted on the wall before deciding on a service.
In a new editorial in JAMA Pediatrics, Dr. Edward Schor, senior vice president at the Lucile Packard Foundation for Children’s Health, argues that traditional pediatric practices would do well to learn from these retail-based clinics, which have burgeoned over the past decade and are being used by many families for much of routine pediatric care.
While research on the quality of care provided at these clinics is scarce, Schor notes that they have adopted standardized, protocol-based practices for high-quality minor illnesses, and they avoid seeing children under 18 months, whose care may be more complex.
If practices are to compete with this new model, Schor suggests, they should consider expanded office hours and after-hours care; same-day and walk-in appointments; co-location of frequently used services; and reassignment of staff to maximize each person’s contribution, among other enhancements.
Schor also writes that practices must improve the overall care experience for busy families and provide consumer-friendly information about pricing. Parents are increasingly concerned with quality, convenience and cost, he notes, and pediatric practices that address these issues will have the best chances of success in the changing landscape of care.
To see an abstract of the article, please click here.
RELATED CONTENT:
Medical Home: What’s in a Name?
Toward a “Triple Aim Medical Home” for Children with Special Health Care Needs
Aiming for Change: Achieving Triple Aim Goals in Pediatricians’ Practices
Kids With Pediatricians Also Getting Care at Clinics, Reuters, 7-22-13
Retail Health Clinics More Popular on Ease for Parents, Bloomberg News, 7-22-13
Posted by kidsdata.org
Post Comment
Slideshow: Fewer California Kids in Foster Care
In California and nationwide, the declining number of children in foster care has been hailed as a child welfare success story, but racial and ethnic inequities and other challenges persist.
In 2012, 55,218 children in California were in foster care, a 49% decline since 1998.
Child welfare experts suggest that these changes are due in part to foster care policy shifts that have sped up adoptions and improved services to families to avoid having to remove children from their homes.
Take a look behind the numbers in this slideshow.
Posted by kidsdata.org
Post Comment
National Safety Month: Behind the Child Injury Trends in California
 As we mark National Safety Month in June, it’s a good time to remember that unintentional injuries, such as motor accidents and trips and falls, are the leading cause of death for children ages 1-19. One in five deaths is due to intentional injuries.
While hospitalizations for injuries among children and youth under age 20 declined by 33% from 1993 to 2010 in California, the state’s rates are still above those of the nation; more than 30,000 children had non-fatal injuries serious enough to require a hospital stay in 2010.
However, with careful planning and precaution, many accidental injuries easily can be prevented. Seatbelt and child seat laws have helped dramatically decrease child injuries and deaths from motor vehicle accidents. Precautions also can be taken to prevent unintentional injury from slipping, tripping, and falling, such as installing gates at the top and bottom of stairs.
To learn more about child injuries, check out these links from kidsdata.org and check back for updated child injury statistics coming soon:
- Injury Hospitalizations
- Intentional Injury Hospitalizations, by Age
- Unintentional Injury Hospitalizations, by Age
More resources:
National Safety Month, National Safety Council
National Center for Injury Prevention and Control, Centers for Disease Control and Prevention
Child Safety and Injury Prevention Resource Brief, Maternal and Child Health Library at Georgetown University
Photo credit: Lindsay Shaver via Flickr
Posted by Amy Lam
Post Comment
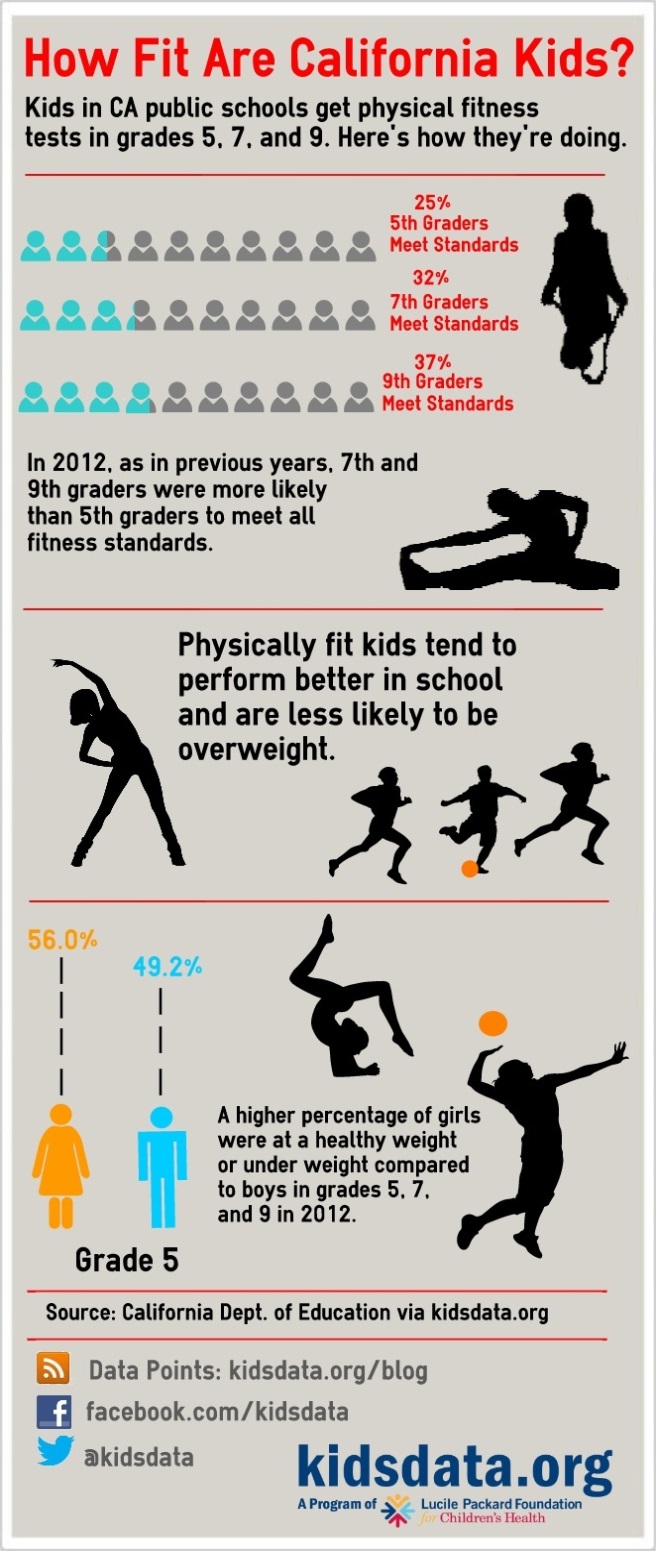
lnfographic: How Fit are California Kids?
California public schools are measuring students’ physical fitness and weight with increasingly sophisticated tests as concerns rise over the number of U.S. kids who are obese or overweight. Here’s an infographic that examines students’ fitness in 5th, 7th and 9th grades. Want more data on kids’ fitness and healthy weight in your community? Click here.
Posted by Roselyn Thomas
Post Comment
Using Kidsdata.org for Grant Proposals: Demonstrating Need
Experienced grantwriters know that crafting a clear and compelling “demonstration of need” is key to getting funding for your project or program.
In fact, more than a third of kidsdata.org users say they use the site to support demonstrations of need and other elements of their grant proposals. In Fresno, for example, kidsdata.org’s statistics helped grantwriter Amy Chubb land an $80,000 grant to educate residents about toxic “brownfields.”
In this post, we’ll show you how to use kidsdata.org to document need in your own community.
First, consider organizing your narrative around two central questions:
1) What is the need?
2) Who are the people in need?
Kidsdata.org can help you provide the answers.
What Is the Need?
Kidsdata.org provides nearly 500 indicators of children’s health and well being in the areas of income, education, physical health, safety and environment, among others. You can explore the data by topic, an A-Z subject index, or enter a keyword in the search bar available on every page to see data for the need you want to demonstrate.
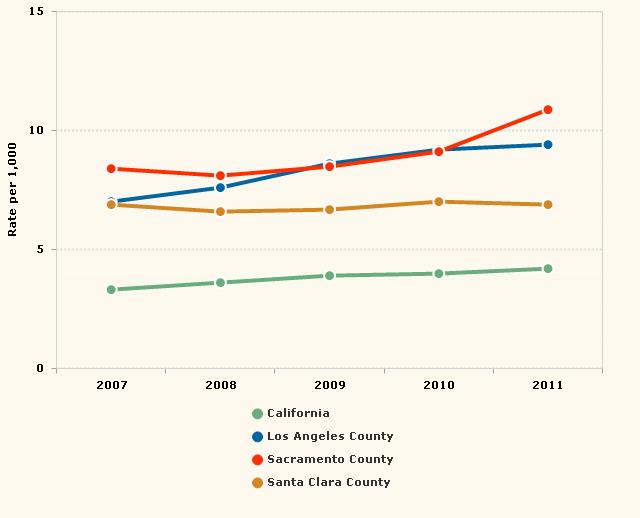
Here’s an example: a nonprofit seeking funding to improve children’s access to preventive mental health care might search for the rate of mental health hospitalizations in its community. A high rate can indicate unmet need for more preventive mental health services.
Hospitalizations for Mental Health Issues Among Ages 15-19: 2007-2011
Who Is in Need? Demographic Indicators
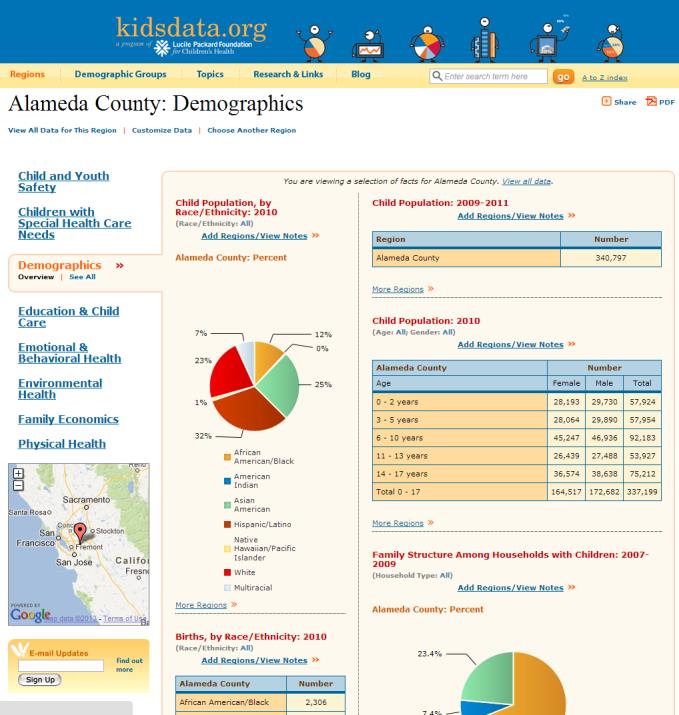
Kidsdata.org also helps you find demographic and other background information about geographic regions across California, to document the needs of the community your program would serve. You can find information about children in counties, cities, and school districts. For example, if you are writing a proposal to support a nonprofit based in Alameda County, kidsdata.org provides a handy overview of the status of children living in the county.
Who Is in Need? Indicators About Specific Populations
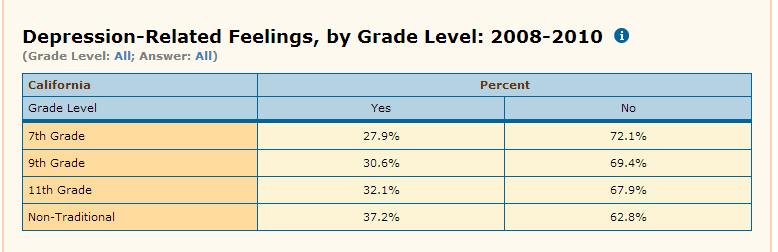
In addition to providing general information on a community, kidsdata.org can help you document the needs of the populations you’re trying to serve. For example, an agency serving at-risk youth can identify trends in bullying and harassment in your county’s school districts or feelings of depression among students (see below). You can customize many indicators by region, year, age or grade level, race/ethnicity, and more, and view the data as maps and tables, or as bar, trend and pie graphs.
You can also download, share, copy and embed charts using these icons, located in the upper right hand corner of the web page.
![]()
In our next post, we’ll share ideas for how to put the needs of your community into context for potential funders.
Are you working on a grant proposal and using kidsdata.org? Please tell us more in the comments or by sharing on the Kidsdata in Action page of our blog. If you have any questions about how to use the tools featured in this post, be sure to Ask a Data Question.
Posted by Roselyn Thomas
Post Comment
How dirty (or clean) is your zip code?
Reposted with permission from HealthyCal.org, by Daniel Weintraub
_________________________________________________________________________________
 Tucked between two traffic-choked freeways, the southeast corner of Santa Ana is among the least healthy places to live in California. The neighborhood’s air is dirtied with diesel emissions and other pollutants. Nearby businesses release an unusually large amount of chemicals. The community has more hazardous waste clean-up sites than almost anyplace in the state. And its groundwater is threatened by contaminants leaking from underground storage tanks.
A few miles away, along the Newport Coast, it’s a different story. Traffic is relatively light, and the air is clean. There are no industrial chemicals to speak of, little hazardous waste exposure and no clean-up sites. The community is one of the healthiest places to live in California.
This tale of two zip codes – 92707 in Santa Ana and 92657 in Newport Beach – emerges from a new online mapping tool that allows Californians to see a detailed environmental report card for the places where they live, work or play.
Promoted as the first of its kind in the nation, the database scores about 1,800 zip codes around the state and then ranks them against each other on 11 different measures of environmental quality, individually and as a group. (The tool uses “census” zip codes, which are very similar to but not always identical to postal zip codes.)
But it doesn’t stop there. Importantly, the tool also combines the environmental results with several demographic measures that reflect a population’s vulnerability – age, poverty, asthma rates, among others — producing a “pollution burden score” that shows which neighborhoods are most at risk for health problems caused by the environment.
The tool, produced by the state Office of Environmental Health Hazard Assessment, is a potentially crucial link in solving the puzzle of how health and place are connected, and why people who live a short distance apart have such wildly different health outcomes.
As currently designed, the scorecard doesn’t do that. The few health measures it uses, such as asthma rates and the number of low-birthweight babies, were included to help measure a population’s vulnerability. Someday, its creators say, they may link their measures of environmental conditions to other sources that assess the health of a population.
In a very crude experiment to see the potential for this kind of analysis, I plugged those two Orange County zip codes into another online tool produced by MeasureofAmerica.org, which compares life expectancy, education and income by community. The results: if you live in that Newport Beach zip code that California’s environmental scorecard ranks as one of the cleaner places in the state, your life expectancy at birth is 88 years. If you’re born into that other neighborhood three or four miles away in Santa Ana, you can expect to live ten years less, or about 78 years.
That’s a huge disparity, and one that can be seen up and down the state. A correlation between environmental conditions and life expectancy is not the same as cause and effect. It would take a rigorous study to get to really flesh out those connections. But where would you rather live?
The state’s tool is still a work in progress, as its name – CalEnviroScreen 1.0 – suggests. Besides lacking a link to health statistics, its ranking system is based on percentiles, not absolute numbers, like a college professor who grades her students on a curve. That means that even if every zip code in the state became nearly pristine but there were still tiny differences among them, the scorecard would still rank them from best to worst, obscuring any assessment of whether they were all healthy places or not.
The tool is also far more difficult to use than it should be in this age of mobile apps and interactive web sites.
To get the most out of the information, the user has to toggle among three different sources — a mapping tool, a sortable spread sheet that contains the raw data, and a thick report that explains what you are looking at. The definitions of the categories assessed are often too cryptic for the average person to understand, and the first version of the tool published last month didn’t even say whether a “low” score or a “high” score in the ranking system was more desirable (it turns out that low scores are better).
But these bugs will likely be worked out in later versions.
“We’re open to suggestions on how to improve the data and make the scores more reliable, and how to make it more accessible to the general public,” said Sam Delson, a spokesman for the office. “We’re a scientific office, and generally our materials are read and responded to by stakeholders, other scientists, and this is something we realize is drawing a lot of public attention.”
Indeed, the web site drew close to 100,000 visitors in its first two days online, and it will likely remain popular. While Delson said it was not intended to be used to guide local land-use decisions, the information it conveys will no doubt be helpful to neighborhoods looking to fight the next hazardous waste dump or high-polluting factory in their midst.
Information is power, and all of the information in the CalEnviroScreen was already available to public, but only to those who knew it was there, knew how to find it and knew how to make it usable.
The new web tools let just about anybody with access to a computer find out how their neighborhood compares to the community down the road and to towns across the state. And then do something about it.
Daniel Weintraub has been covering California public policy for 25 years. He is editor of the California Health Report at www.healthycal.org
Posted by kidsdata.org
Post Comment
Teen Birthrates Continuing to Fall Nationwide. What’s Happening in California?
 Teen birth rates in the U.S. continue to drop at a rate that astonishes and delights public health officials, who note that having babies so young creates health and economic risks for both mom and infant.
“The nation’s record-low teen birth rate stems from robust declines in nearly every state, but most dramatically in several Mountain States and among Hispanics,” the Associated Press reports.
In California, teen birth rates fell from 2005-2010, notably among Latinas. The state’s teen birth rate decreased by more than 50% between 1995 and 2010, from 62.9 per 1,000 young women ages 15-19 to 29.0.
To see more details for California and your county, check out these kidsdata.org indicators:
More resources on teen pregnancy and teen births:
- Guttmacher Institute: Adolescents
- No Time for Complacency: Teen Births in California, Center for Research on Adolescent Health and Development, Public Health Institute
- Teen Pregnancy Prevention, California Department of Public Health
- Teen Sex and Pregnancy, Child Trends
- The National Campaign to Prevent Teen and Unplanned Pregnancy
Posted by kidsdata.org
Post Comment
Children’s Mental Health in California: Rising Hospitalizations, Shrinking State Budget
As we wrap up National Children’s Mental Health Awareness Week (May 5-11), we’re seeing a striking increase in mental health-related hospitalizations of California kids.
This chart shows that the number of hospitalizations of California children ages 5-14 for mental health reasons has risen about 30% since 2007, even as the state’s child population has dipped slightly in that time period. In 2011, there were 11,687 hospitalizations for mental health issues among children ages 5-14 in California and 23,514 among youth ages 15-19. Mental health issues are the most common reason for hospital stays among California’s children.
At the same time, California cut its state mental health budget by about $750 million, or about 20%, between 2009 and 2012 according to a report by the National Alliance on Mental Illness. The result, the NAMI report suggests, is that California has seen a decrease in the availability of preventive and community-based mental health treatment options.
And as mental health services become harder for kids and teens to obtain amid budget cuts, the burden of mental health care shifts to hospital emergency departments, Dr. Mark Pearlmutter of the American College of Emergency Physicians said during a recent Congressional briefing sponsored by the National Association of State Mental Health Program Directors. Nationally, the demand for mental health services is rising at the same time that states continue to cut budgets.
According to a 2010 federal report on mental health in the United States, nearly half of children who met criteria for having any mental disorder did not get the treatment they needed.
Interested in learning more? Check out our other measures of California children’s mental and emotional health here.
 Children’s Mental Health in the News
More U.S. Kids Diagnosed with Mental Health Disabilities, Study Finds
(U.S. News, 5/5/13, by Gordon)
http://health.usnews.com/health-news/news/articles/2013/05/05/more-kids-diagnosed-with-mental-health-disabilities-study-finds
Many Suicidal Children Have Access to Guns at Home, Study Finds
(USA Today, 5/6/13, by Szabo)
http://www.usatoday.com/story/news/nation/2013/05/06/suicidal-children-access-guns-home/2136931/?sf12472167=1
Prolonged Fatigue Linked to Mood and Anxiety Disorders in Teens, Study Finds
(Scope, 5/1/13, by Steakley)
http://scopeblog.stanford.edu/2013/05/01/prolonged-fatigue-and-mood-disorders-among-teens/
Abused Children Get Unique form of PTSD
(TIME, 4/30/13, by Szalavitz)
http://healthland.time.com/2013/04/30/abused-children-may-get-different-form-of-ptsd/
Posted by Roselyn Thomas
1 Comment
CA Public School Enrollment Continues Decline
Although California’s public school enrollment rose nearly 20% in the past two decades, it has been on a slight but consistent decline since 2005, in a reflection of California’s shrinking child population.
Approximately 6.2 million K-12 students were enrolled in public school in 2012, down about 2% since 2005, according to new data available from kidsdata.org.

Some counties have seen sharper declines, including Los Angeles County, where public school enrollment dipped 9% between 2005 and 2012. Some rural counties with small student populations shrank by as much as 32% during that period.
The data also show a striking shift in the racial/ethnic composition of public school students. The percentage of Latino students enrolled in California public schools continues to rise, with Latino students comprising 52% of all public school students in 2012.
In contrast, the proportion of white students continues to shrink: they made up 31% of public school children in 2005, compared to 26% in 2012. African American student enrollment also declined by nearly 20% between 2005 and 2012.
In general, as school enrollment decreases, so does average daily attendance (ADA). Declines in ADA result in decreased per pupil funding from the state.
This interactive motion chart highlights trends in public school enrollment across California. By default, the number of children in each racial/ethnic group is shown. Press play to see changes over time.
Hints:
– To follow the progression of a particular racial/ethnic group, hover over or click a bar.
– Change view from “number” to “percent” by clicking on the left axis.
For more information on public school enrollment, including county- and school district-level data, click here. For more information on the racial and ethnic composition of public school students, click here. For our complete data advisory on public school enrollment, click here.
Posted by kidsdata.org
Post Comment