

Using Kidsdata.org for Grant Proposals: Demonstrating Need
Experienced grantwriters know that crafting a clear and compelling “demonstration of need” is key to getting funding for your project or program.
In fact, more than a third of kidsdata.org users say they use the site to support demonstrations of need and other elements of their grant proposals. In Fresno, for example, kidsdata.org’s statistics helped grantwriter Amy Chubb land an $80,000 grant to educate residents about toxic “brownfields.”
In this post, we’ll show you how to use kidsdata.org to document need in your own community.
First, consider organizing your narrative around two central questions:
1) What is the need?
2) Who are the people in need?
Kidsdata.org can help you provide the answers.
What Is the Need?
Kidsdata.org provides nearly 500 indicators of children’s health and well being in the areas of income, education, physical health, safety and environment, among others. You can explore the data by topic, an A-Z subject index, or enter a keyword in the search bar available on every page to see data for the need you want to demonstrate.
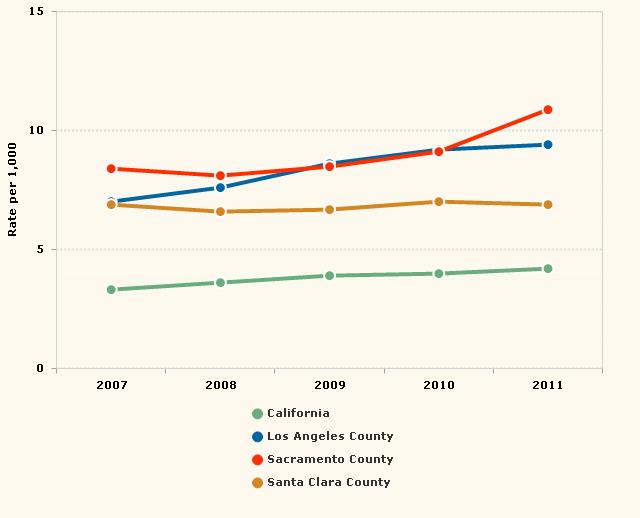
Here’s an example: a nonprofit seeking funding to improve children’s access to preventive mental health care might search for the rate of mental health hospitalizations in its community. A high rate can indicate unmet need for more preventive mental health services.
Hospitalizations for Mental Health Issues Among Ages 15-19: 2007-2011
Who Is in Need? Demographic Indicators
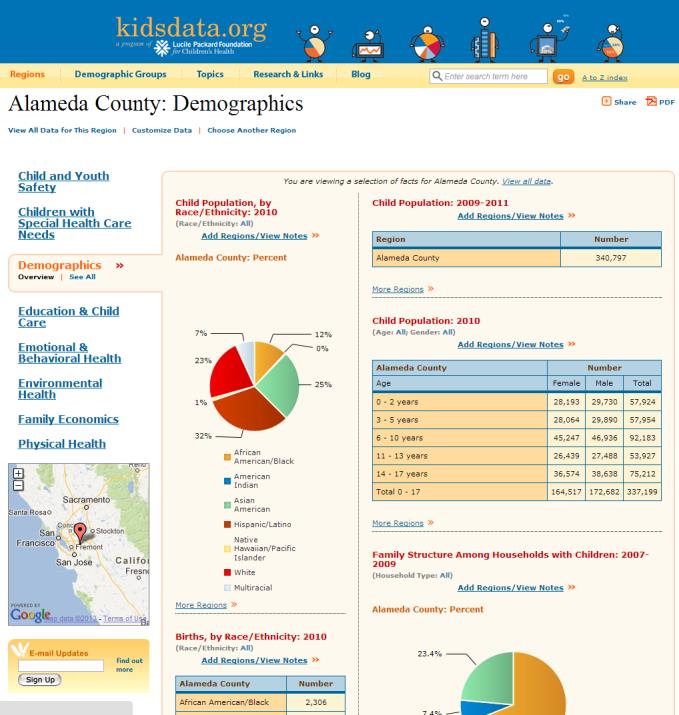
Kidsdata.org also helps you find demographic and other background information about geographic regions across California, to document the needs of the community your program would serve. You can find information about children in counties, cities, and school districts. For example, if you are writing a proposal to support a nonprofit based in Alameda County, kidsdata.org provides a handy overview of the status of children living in the county.
Who Is in Need? Indicators About Specific Populations
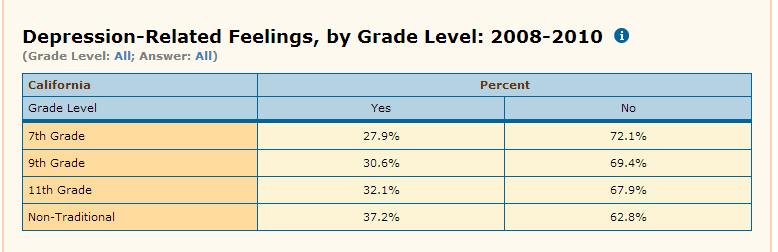
In addition to providing general information on a community, kidsdata.org can help you document the needs of the populations you’re trying to serve. For example, an agency serving at-risk youth can identify trends in bullying and harassment in your county’s school districts or feelings of depression among students (see below). You can customize many indicators by region, year, age or grade level, race/ethnicity, and more, and view the data as maps and tables, or as bar, trend and pie graphs.
You can also download, share, copy and embed charts using these icons, located in the upper right hand corner of the web page.
![]()
In our next post, we’ll share ideas for how to put the needs of your community into context for potential funders.
Are you working on a grant proposal and using kidsdata.org? Please tell us more in the comments or by sharing on the Kidsdata in Action page of our blog. If you have any questions about how to use the tools featured in this post, be sure to Ask a Data Question.
Posted by Roselyn Thomas
This entry was posted on Monday, June 3rd, 2013 at 9:07 am. You can follow any responses to this entry through the RSS 2.0 feed. You can leave a response, or trackback from your own site.