

Higher-income students 2x more likely to meet standards for CA’s new common core tests

Higher-income California students are more than twice as likely to meet or exceed grade-level standards on California’s new standardized tests compared to their lower-income counterparts, according to the first year of published test results, which are now available to compare and visualize, by county and by district, on Kidsdata.
For the English Language Arts/Literacy (ELA) test, 64 percent of non-economically disadvantaged students met or exceeded test standards, versus 30 percent of economically disadvantaged students. For the mathematics test, 52 percent of non-economically disadvantaged students met or exceeded test standards, versus 21 percent of economically disadvantaged students. Economic disadvantage is determined by whether or not a student is eligible for the state’s free or reduced price lunch program or if neither of the student’s parents graduated from high school.
When broken down by county, the wealthier Bay Area counties tended to show the highest rates of students passing these exams, while inland, central valley and more rural counties had the lowest rates.
The Smarter Balanced ELA and math tests, which are both administered online, replaced the paper-based Standardized Testing and Reporting (STAR) program, which had been the statewide testing system since 1998. Students in grades 3-8 and high school juniors take the Smarter Balanced tests, which assess the Common Core principles of critical thinking and writing as well as real-world application.
Each state is required to test at least 95 percent of its students, both state-wide and district-wide, in order to receive federal funding. In 2015, 97 percent of California students took the Smarter Balanced tests, but 21 school districts failed to meet the threshold due to parental exemptions. In the Palo Alto Unified School District, for example, 50 percent of juniors at both of the city’s high schools opted out of the 2015 tests due to their proximity to the Advanced Placement and SAT exams.
Early intervention is critical for children who are struggling with reading and math. Limited skills in these subjects can have effects into adulthood, too, as proficiency in both reading and math is associated with better employment and income prospects.
According to experts, policy options that could improve reading and math proficiency include: ensuring that all children have access to high-quality preschool or kindergarten readiness programs, supporting strategies to involve families in school, evaluating the state’s new accountability system for effectiveness, and providing equitable student access to Common Core-aligned curricula as well as the technology needed for Smarter Balanced testing.
Related Data:
- Students Meeting or Exceeding Grade-Level Standard in English Language Arts (CAASPP), by Grade Level
- Students Meeting or Exceeding Grade-Level Standard in Mathematics (CAASPP), by Grade Level
Helpful Links
Achievement Gap Points to Ineffectiveness of Decades of Reforms, EdSource
Health and Academic Achievement, Centers for Disease Control and Prevention
Student Achievement in California: 2015 California Assessment of Student Performance and Progress (CAASPP) Results, Education Trust–West
The Local Control Funding Formula: An Essential EdSource Guide (PDF), EdSource
The Power of Parents: Research Underscores the Impact of Parent Involvement in Schools, EdSource and New America Media
The Whole School, Whole Community, Whole Child Model, Journal of School Health
Time for Equity: Expanding Access to Learning, Voices in Urban Education
Posted by kidsdata.org
Post Comment
Nine percent of young CA children have never seen a dentist

On the heels of the Little Hoover Commission’s scathing report on Denti-Cal, the dental health care program for 13 million low-income Californians, Kidsdata now offers the latest data on the Length of Time Since Last Dental Visit for kids in California. The data come from the California Health Interview Survey and are now available to view and visualize on Kidsdata.
The data show that in 2013-2014, nine percent of children ages 2-11 had never had a dental visit. The counties with the highest percent of young children who had never visited a dentist were San Joaquin County at 28 percent, Shasta County at 19 percent, and Fresno County at 18 percent. In over 12 additional counties, at least 10 percent of children hadn’t visited a dentist, including Santa Clara County, Sacramento County, and Los Angeles County.
Tooth decay is the most common chronic disease (PDF) among children ages 6-18. Untreated dental problems, such as cavities and gum disease, can affect a child’s health and quality of life by causing pain, nutritional and sleep problems, impaired concentration, and increased school absences, as well as lost work hours for parents. If dental disease is not treated early, it can result in more serious and expensive intervention later on.
Tooth decay and other oral diseases disproportionately affect low-income children, children of color, and uninsured children. For this reason, the federal government has set a public health goal focused on improving access to preventive dental services for low-income children. The federal Affordable Care Act (ACA) includes dental health care for children in the essential health benefits that must be covered by all qualified health insurance plans, a major step forward in ensuring access to oral health care for children.
According to experts, policy options that could influence children’s dental health include: increasing reimbursement rates for dental providers under public insurance programs, creating incentives for them to treat low-income children; increasing the number of pediatric dentists where Medi-Cal patients live; setting pediatric dental benefits under ACA at affordable rates to allow low-income families to access the services; reinstating state support for children’s dental disease prevention (PDF); and ensuring that all communities have fluoridated drinking water, as evidence suggests that it reduces cavities among children.
Related Data:
- Unmet Needs for Preventive Dental Care Among Children with Special Health Care Needs
- Delayed or No Medical Care
- Length of Time Since Last Routine Health Check-Up
Helpful Links
Children’s Dental Health Project
Dental Care Access for Children in California: Institutionalized Inequality, Lucile Packard Foundation for Children’s Health
Oral Health Care in CSHCN: State Medicaid Policy Considerations, Pediatrics
Racial Disparity Trends in Children’s Dental Visits: US National Health Interview Survey, 1964–2010, Pediatrics
Posted by kidsdata.org
Post Comment
Kidsdata Welcomes Lori Turk-Bicakci!
The Lucile Packard Foundation for Children’s Health is excited to welcome Lori Turk-Bicakci to the Kidsdata team as our new senior manager of data and research.
Before joining the Foundation, Dr. Turk-Bicakci was a senior researcher and project director at American Institutes for Research. She has extensive experience with project management, data collection, analysis, and reporting for social welfare and education research projects and has a particular interest in examining and diminishing disparity.
Her most recent project was a large-scale, multi-year evaluation of a law change to the California Work Responsibility and Opportunity for Kids (CalWORKs) program intended to promote self-sufficiency among families in poverty. Also, she is a certified project management professional (PMP) and a certified reviewer for What Works Clearinghouse (WWC) to assess quality of research studies.
Before her graduate studies in sociology, Dr. Turk-Bicakci was a middle school social studies teacher.
To contact Lori, you can reach her via email.
Posted by kidsdata.org
Post Comment
Child Abuse Cases in CA Drop by 1/4 in Last Decade

For Child Abuse Prevention Month, we are happy to report some good news: The rate of substantiated cases of child abuse and neglect in California dropped by 25 percent between 2004-2014, according to the most recent data available on Kidsdata.
More than 80 percent of counties saw a decline in their rates of substantiated child abuse cases during this time period. Merced, Lake, Santa Cruz, and Colusa counties all saw the steepest declines. During the entire 10-year period, higher rates were concentrated in the state’s northern counties.
23 per 1,000 children in both the African American and American Indian communities experienced substantiated cases of abuse in 2014, the highest by far among ethnic groups. Rates for those two groups were also the highest in 2004. Children ages 0-5 make up nearly half of all substantiated abuse cases, but only one-third of the state’s child population. In addition, children with special needs and those in the foster care system are also at higher risk of abuse.
Children who are abused or neglected are more likely to experience cognitive, emotional, and behavioral problems, as well as disruptions in brain and physical development, which increase the risk for health problems in adulthood. Children who are abused or neglected also are more likely to repeat the cycle of violence by entering into violent relationships as teens and adults or by abusing their own children.
Beyond the impact on individuals, child abuse has a significant impact on society; the total lifetime economic cost due to new child maltreatment cases in a single year is estimated at $124 billion in the U.S.
While California has made major strides in these areas in recent years, continued efforts are needed to ensure the safety of all children. According to experts, programs that can help address child abuse/neglect include: continuing to ensure that effective prevention services are in place, including risk assessment and home-visiting services for families with children at risk of abuse; supporting policies that help reduce family stress, promote stable environments for children, and ensure that affordable child care is available; and providing an accessible system of mental health services for parents and children.
Related Data:
Helpful Links
Children and Family Services Division, California Dept. of Social Services
Office of Planning, Research & Evaluation: Abuse, Neglect, Adoption & Foster Care, U.S. Dept. of Health and Human Services, Administration for Children & Families
A Hidden Crisis: Findings on Adverse Childhood Experiences in California, Center for Youth Wellness
Cost of Child Abuse and Neglect Rival Other Major Public Health Problems, National Center for Injury Prevention and Control
Income Inequality and Child Maltreatment in the United States, Pediatrics
Subsequent Maltreatment in Children With Disabilities After an Unsubstantiated Report for Neglect, JAMA: The Journal of the American Medical Association
Posted by kidsdata.org
Post Comment
Number of CA Students with Autism Rises Sixfold Since 2002
April is Autism Awareness Month, and Kidsdata has released the latest data on California’s special education enrollment for students with autism. Between 2002 and 2015, the number of public school students in California enrolled in special education due to autism has risen sixfold, from 13,276 to 90,794 students. In 2002, autism was the 6th most common disability among special education students, but by 2015, it had risen to the third most common disability.
Nationwide, the identified prevalence of autism spectrum disorder (ASD) has more than doubled from one in 150 school-aged children in 2000 to one in 68 in 2012, according to the most recent data from the Centers for Disease Control and Prevention.
Has the prevalence of autism actually risen or does the upward trend reflect broadened diagnostic criteria and increased awareness of the disorder? Some researchers point to “diagnostic substitution,” meaning that a child diagnosed with autism today may have been dubbed mentally retarded in years past. It wasn’t until 1992 when the Individuals With Disabilities Education Act (IDEA) included autism as a special education reporting category. And while the causes of autism are largely a mystery, most researchers agree that both genetics and environmental factors, such as exposure to pesticides during pregnancy, may play a role.
The Centers for Disease Control and Prevention is stressing the importance of early identification through its “Learn the Signs. Act Early” program. In 2012, only 43 percent of children identified with ASD received developmental evaluations by the age of three. Black and Latino children tend to receive diagnoses at even older ages. By prioritizing early identification, children with ASD can access special services and support during the crucial stages of early childhood development.
Related Data:
- Special Education Enrollment
- Demographics of Children with Special Needs
- Access to Services for Children with Special Health Care Needs
- Impact of Special Health Care Needs on Children & Families
- Quality of Care for Children with Special Health Care Needs
Helpful Links
California Dept. of Education: Special Education
Individuals with Disabilities Education Act (IDEA)
Lucile Packard Foundation for Children’s Health
National Center for Learning Disabilities
Students with Disabilities and California’s Special Education Program, 2009, Public Policy Institute of California
Kidsdata Tip
From the Ventura County Star to the Napa Valley Register, Kidsdata is often in the news. Keep up with the latest in children’s health news by following Kidsdata on Facebook and Twitter.
Posted by kidsdata.org
Post Comment
California’s food stamp recipients rise by 123% in last decade

Between 2006 and 2015, the number of California residents receiving food stamps rose 123 percent, from just over two million people to nearly 4.5 million people, according to the latest data on Kidsdata. That’s 12 percent of the state’s entire population. According to the California Department of Social Services, more than half of the state’s food stamp recipients are children.
Los Angeles, San Bernardino, Riverside, and San Diego counties all saw more than 200,000 additional food stamp recipients in the last decade. In Los Angeles county alone, more than half a million new recipients received benefits for food stamps during this time period.
While it’s no surprise that more Californians would sign up for food stamps during the Great Recession between 2007-2009, the question remains: Why has the number continued to rise in the five years since the recession ended? Although unemployment rates have fallen, “the historical record shows that declines in poverty and [food stamp] enrollment typically lag behind improvements in the unemployment rate following recessions,” according to an article published last week by the Center on Budget and Policy Priorities. Another major factor is that in 2008, Congress permitted states to relax their eligibility standards for the national food stamp program.
Research shows that food insecurity can seriously affect children’s cognitive and physical development. Hunger can also hinder school attendance, academic achievement, graduation rates, and job readiness.
Currently, hunger relief advocates are asking Congress to pass a strong Child Nutrition Reauthorization Act, which would provide nutritious food to children at school, in child care, and during weekends and school holidays, and to strengthen the federal Supplemental Nutrition Assistance Program (SNAP) that provides food for 45 million low-income Americans (PDF). Other policy recommendations include making it simpler and less stigmatizing for students to access free and reduced-price school meals and ensuring the availability of nutritious, appealing foods at school meals without competition from less healthy foods.
Related Data:
- CalFresh (Food Stamp) Participation
- Children Living in Food Insecure Households
- Student Eligibility to Receive Free or Reduced Price School Meals
Helpful Links
California Food Policy Advocates
Enrollment in Health and Nutrition Safety Net Programs Among California’s Children, Public Policy Institute of California
How Hungry Is America?, Food Research & Action Center
Promoting Food Security for All Children, Pediatrics, American Academy of Pediatrics Council on Community Pediatrics, Committee on Nutrition
Nutrition & Food Insecurity Profiles, California Food Policy Advocates
Posted by kidsdata.org
Post Comment
California’s Latino and Black students make gains in math proficiency

“The Math Revolution,” an article in this month’s issue of The Atlantic, discusses a key set of American students who are increasingly excelling at world-class math. Last year, the US won first place in the International Mathematical Olympiad, the writer cites. But gains aren’t just taking place at the highest echelons of high school academia. Kidsdata’s newest data on math proficiency in California (for both the CAHSEE and CAASPP exams) give us a snapshot of how our students are faring in this key subject. Although California ranks below the national average in student math scores, these new data reveal that 10th graders in our state, from all ethnicities and socioeconomic backgrounds, experienced a notable rise in math achievement over the past decade.
Statewide, 85 percent of 10th-grade students passed the high school exit exam in math in 2015, signaling a 15 percent rise since 2005. When broken down by race, however, it’s clear that the largest gains were made among Latino and Black students, who each saw a 29 percent improvement. In 2015, 80 percent of Latino 10th graders and 71 percent of Black 10th graders passed the high school exit exam in math, compared to 62 percent and 55 percent a decade earlier. When broken down by socioeconomic status, the decade-long trend shows that 30% more economically disadvantaged 10th graders passed the high school exit exam in math, versus 9% more of their higher income peers. Still, disparities remain, with 93 percent of higher income 10th graders passing the exam versus 79 percent of economically disadvantaged students.
Basic math skills are essential to navigate through life, and competence in mathematics is associated with readiness for the workplace and higher future earnings. Math proficiency also is a predictor of college attendance. Nationwide, increasing emphasis is being placed on children’s achievement in mathematics, science, technology, and engineering, recognizing the importance of these fields in the country’s future and ability to innovate.
Significant education policy changes have taken place in California and the U.S. in recent years, such as the state’s Local Control Funding Formula, the Common Core State Standards, the Smarter Balanced Assessment System, and the Every Student Succeeds Act. Policymakers now face challenges in effectively implementing these large-scale changes, which have the potential to reduce long-standing achievement gaps in math proficiency by race/ethnicity, income level, disability status, and English Learner status.
According to experts, policy options that could improve math proficiency include ensuring that all children have access to high-quality preschool or kindergarten readiness programs, which lay the foundation for later achievement; supporting effective strategies to involve families in school; and ensuring that all students have access to high-quality Common Core-aligned curricula and other classroom support.
Related Data:
- Students Meeting or Exceeding Grade-Level Standard in Mathematics (CAASPP), by Grade Level
- Tenth Grade Students Passing the High School Exit Exam in Math
- Students Meeting or Exceeding Grade-Level Standard in English Language Arts (CAASPP), by Grade Level
Helpful Links
California Dept. of Education: Mathematics
Changing the Equation: Ensuring the Common Core Math Standards Enable All Students to Excel in California Schools, Education Trust–West
Improving the Opportunities and Outcomes of California’s Students Learning English: Findings from School District–University Collaborative Partnerships, Policy Analysis for California Education
The Progress of Education Reform: Math in the Early Years: A Strong Predictor for Later School Success, Education Commission of the States
Student Achievement in California: 2015 California Assessment of Student Performance and Progress (CAASPP) Results, Education Trust–West
The Power of Parents: Research Underscores the Impact of Parent Involvement in Schools, EdSource and New America Media
Posted by kidsdata.org
Post Comment
How safe is California’s water for kids?
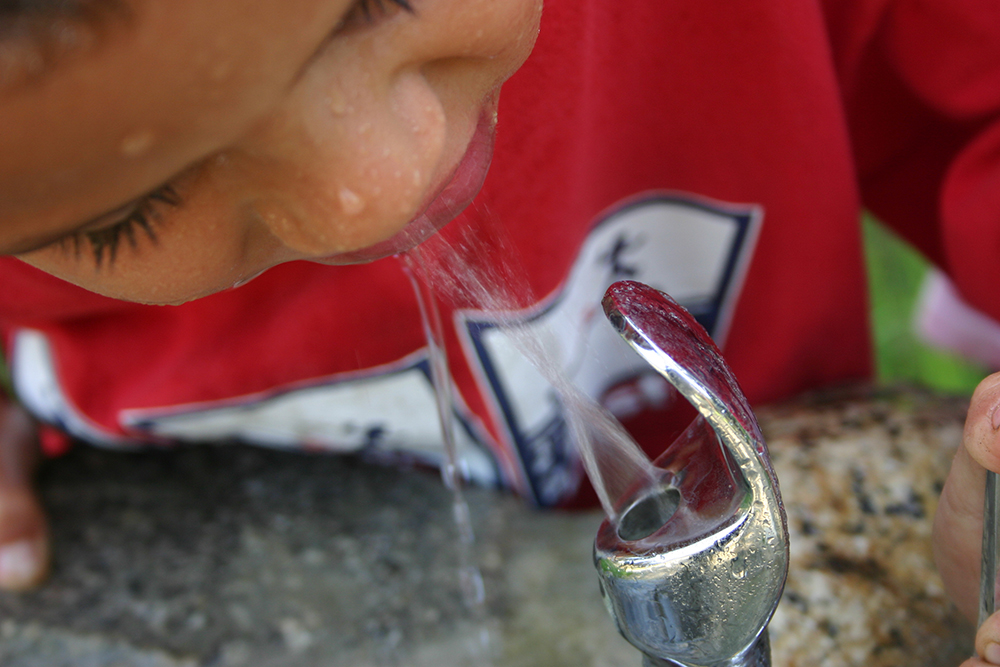
The Flint water crisis has caused families across the country to wonder about the safety of the drinking water in their own homes, schools, and communities. According to the most recent data from the California Environmental Protection Agency displayed on Kidsdata beginning this month, the state issued 1,666 Maximum Contaminant Level (MCL) Violations to counties whose drinking water contained contaminant levels that exceeded public health limits in 2014. Since 2005, that number has risen by 81%.
Although these data do not indicate the severity of the violation, they do measure risk of exposure to harmful chemicals through drinking water. The counties with the most violations were all concentrated in the state’s central valley. In fact, five central valley counties—Fresno, Kern, Tulare, San Joaquin, and Stanislaus—together were home to 48% of the state’s total MCL violations in 2014. To make matters worse, they also rank among the top 20 counties for child population.
Clean, safe drinking water is essential to child health and learning. Access to high-quality drinking water at home, schools, and child care facilities limits children’s exposure to harmful contaminants and can increase consumption of water. The state’s Rethink Your Drink Campaign encourages children to make healthy drinking choices by consuming water rather than sugary beverages.
Exposure to contaminants in drinking water can result in numerous adverse health effects for children, such as impaired cognitive functioning, gastrointestinal issues, liver or kidney damage, cancer, and neurological damage.
According to experts, policy and program options to improve children’s access to safe drinking water include: ensuring that schools implement routine measures per Environmental Protection Agency guidelines to limit contamination; educating residents and community groups in areas without safe drinking water on what they can do to keep their families safe in the short term; continuing to develop sustainable solutions to help prevent groundwater contamination, treat contaminated water, and ensure that safe, affordable drinking water is provided for small public water systems in disadvantaged communities.
Related Data:
Helpful Links
Children’s Environmental Health Network
Protecting Children’s Environmental Health, U.S. Environmental Protection Agency
Communities that Rely on a Contaminated Groundwater Source for Drinking Water (PDF), State Water Resources Control Board
Costs of Environmental Health Conditions in California Children, California Environmental Health Tracking Program
Fact Sheet: Drinking Water Access in Schools (PDF), California School Boards Association
The Human Right to Water Bill in California: An Implementation Framework for State Agencies (PDF), International Human Rights Law Clinic, U.C. Berkeley, School of Law
Posted by kidsdata.org
Post Comment
Kidsdata is hiring!

Do you love kidsdata.org? Have you ever thought about joining our team? Kidsdata is hiring a Senior Manager, Data and Research, to oversee the quality of the site’s content and to ensure that the site continues to help improve the health and well-being of children in California.
The ideal candidate will be deeply committed to the mission of Kidsdata and the Lucile Packard Foundation for Children’s Health. S/he will have a research-based understanding of the social-economic, systemic forces affecting the health and well-being of children, their families, and their communities.
S/he also will have expertise regarding California’s data on child health and well-being, and how data, technology, strategic partnerships, and communication strategies can be used effectively to improve children’s lives. S/he will have demonstrated success in managing large-scale, multi-faceted projects, exemplary interpersonal and communication skills, a strong track record of professional success, and a strong team orientation.
This is a full-time position, with excellent benefits, based in Palo Alto, CA.
Read the complete job description.
Want more background? Read About Kidsdata.
Posted by kidsdata.org
Post Comment
40% of CA 5th graders are overweight or obese, 2015 data show

Two of every five 5th graders in California’s public schools are overweight or obese, according to 2015 data from the California Department of Education that are now available on Kidsdata.
All California public school students in grades five, seven, and nine are required to take the Physical Fitness Test, which includes an assessment of body composition. Students are considered overweight or obese if their body composition scores reach beyond the Healthy Fitness Zone, which represents a level of fitness that offers protection against the diseases that result from sedentary living.
Not only are the percentages of students who are overweight or obese high in California, the data reveal substantial disparities between ethnicities. 56% of Pacific Islander 5th graders for example, were considered overweight or obese—more than double the percentage of Asian American 5th graders.
The data also vary widely by county. In some counties, less than 20% of 5th graders were considered overweight or obese, but in one, the percentage reached above 50%.
Nationwide, the childhood obesity rate has more than doubled in children and quadrupled in adolescents over the past 30 years. Today, about one third of children ages 2-19 are overweight or obese in the U.S. Overweight children are at higher risk for a range of health problems, including heart disease, stroke, asthma, and some types of cancer; they also are more likely to stay overweight or obese as adults.
California has been a leader in advancing policies to combat childhood overweight and obesity, from banning soft drinks and unhealthy food in schools to requiring nutrition labeling in chain restaurants. Yet the state continues to battle an obesity epidemic among children. Reducing childhood obesity requires policies that promote equitable access to safe places to play and exercise, frequent opportunities for physical activity in and out of school and affordable healthy foods and beverages. Public policy can make a difference by changing the environment in which children make food choices, live, go to school, and play.
Related Data:
Weight
Physical Fitness
- Students Meeting All Fitness Standards, by Grade Level
- Physical Education and Activity Opportunities at School
- Students Who Are Healthy and Physically Fit
Helpful Links
California Project LEAN, California Department of Public Health & Public Health Institute
Centers for Disease Control and Prevention: Childhood Overweight and Obesity
Healthy Eating Research, Robert Wood Johnson Foundation
Let’s Move! America’s Move to Raise a Healthier Generation of Kids
Increasing Socioeconomic Disparities in Adolescent Obesity, Proceedings of the National Academy of Sciences
Socioeconomic Status and the Health of Youth: A Multi-level, Multi-domain Approach to Conceptualizing Pathways, Psychological Bulletin
Posted by kidsdata.org
Post Comment