Posts Tagged ‘Data Projects’
Healthy City Tool Tracks Local Census Response
We’ve talked before about the need to see every person counted in the 2010 Census, and we’ve noted California’s particular challenge to that end (10 of the 50 hardest-to-count counties are right here in our state). Today we applaud our colleagues at Healthy City for offering Census2010.HealthyCity.org. The site presents current Census participation rates, hard-to-count scores from the last Census for communities statewide, and a weekly analysis of low-response areas — key information that will inform outreach strategy as it’s happening.
Remember: Today is the last day to mail back your census form!
Posted by kidsdata.org
Tags: Data Projects
Fun with Data Mashing
 |
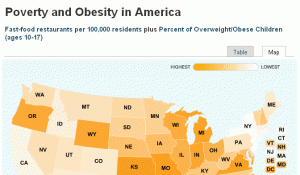
From datamasher.org, this is an example of a data mash-up of fast food restaurants and child obesity rates. |
Kidsdata.org has a wealth of data related specifically to children in California, but what if you want to compare California against other states and different indicators? You might want to try Datamasher.org, a website that allows users to get creative by comparing indicators from different states against each other. Users can view others’ mash-ups, then vote on them to help determine how useful they are.
Take, for instance, the mash-up titled Money Spent per Student and SAT Scores. This mash-up combines reading and mathematics SAT scores with expenditure per pupil at public schools. California students had an average combined SAT score of 1,015, with the state spending $7,905 per student, which puts California about the middle (29th) on the list for most SAT points per dollar spent. The worst state was New Jersey, where the average SAT was 1,005, but state spending per student was $14,117 – nearly double the expense of California. Utah ranked the best, with an average score of 1,114 and $5,216 spent per student.
When it comes to Most Reproductive States, California ranks 9th with 562,440 births divided by the state’s 2008 population of nearly 37 million. The West and Southwest has some of the most reproductive states, with Utah again ranking 1st, while the Northeast has some of the least reproductive states, with Maine ranking 50th.
Have you created a mashup on kids’ health? Add it here!
Posted by kidsdata.org
Tags: Data Projects
Putting CA’s High Unemployment Rates in a National Perspective
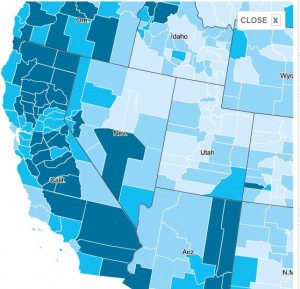
 The Washington Post offers an informative map of unemployment rates, by county, across the United States. On the Post’s map, take note, too, of the “autoplay changes” feature, a helpful visual tool that shows how the recession took hold across America from Jan. 2007 to Nov. 2009.
When you focus on California, you see some troubling signs. From Imperial County through the Inland Empire to the Central Valley and on up to the Oregon border, California’s middle is experiencing among the highest levels of unemployment in the United States. In Imperial County, in fact, the unemployment rate in January 2010 was a shocking 27%, which appears to be among the highest, if not the highest, percentages in the country. The connection between unemployment rates and kids’ well being is perhaps obvious, but this brief paragraph from kidsdata.org makes the point clear:
Not only can unemployment be a barrier to a family’s economic security, it also can place families under stress, affecting children’s emotional health and other aspects of their well being, such as access to health insurance. Children from low-income families are more likely to go hungry; reside in overcrowded or unstable housing; live in unsafe neighborhoods; and receive a poorer education. They also tend to have less access to health care, child care, and other community resources, such as quality after-school programs, sports, and extracurricular opportunities.
Posted by Andy Krackov
Tags: Data Projects
California’s Unparalleled Data Offerings
 California may be money-poor these days, but it’s surely data-rich, and that’s got to count for something. After all, is there anywhere else in the country where you can find so many useful data websites focused on the well being of a state and its inhabitants? Today, California’s offerings became even more robust with the launch of HealthyCity, which provides access to numerous local-level datasets and listings of wide-ranging services. Our congratulations to our colleagues at the Advancement Project for making HealthyCity available statewide.
Kidsdata.org and HealthyCity have a lot in common, particularly a goal to provide easy access to data and a desire to present these facts in a number of formats, from charts to maps. While our two sites both offer measurements of key indicators, they are inherently different, and undoubtedly will be used in different ways across the state. That’s a good thing. Given the magnitude of California’s problems these days, it’s critical that we have multiple tools to analyze issues and propose solutions. To that end, we’re looking forward to working with HealthyCity to ensure that Californians have a wealth of data at their fingertips. That’s a big first big step toward improving the health of California’s kids.
Posted by Andy Krackov
Tags: Data Projects
Just Released: Children Now’s Annual Report Card
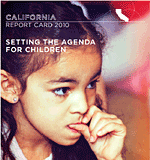
 Children Now recently released its annual report card, offering an issue-by-issue assessment on how California’s kids are faring. Most of the grades ranged from Cs to Ds. The highest grade was a B+ in the afterschool category. Children Now points out that the overall grade point average in 2010 was lower than at any other time in the 20-year history of the report card.
Posted by Andy Krackov
Tags: Child Health Initiatives, Data Projects
A Decade of Improvement for CA’s Kids
 There are, of course, numerous ways to measure how kids in California are doing –
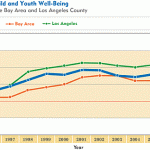
you need only look at the list of individual indicators available through kidsdata.org to find hundreds of different measurements, from poverty to infant mortality to college readiness. But have you ever wondered whether the overall well-being of California’s children is improving or deteriorating? California now has a tool, the California Index of Child and Youth Well-Being, to do just this – that is, provide a measure of kids’ overall status over time. The index, which is based on 16 key indicators from kidsdata.org, shows a consistent pattern of improvement in how children have fared over the last decade, but it also warns that the present economic recession could undermine and possibly even reverse those gains. Some key results from this study:
- Child well-being from 1995 to 2006 improved by about 16% for children in
California. Results also are available for the state’s two
major population centers (the Bay Area and Los Angeles
County), both of which also registered gains in child well-being.
- Child well-being also improved for all racial/ethnic groups that could be
examined by available data (African American, Asian, Caucasian, and
Latino). However, racial/ethnic disparities persisted over time.
African American children, in particular, consistently fared worse than their
Caucasian peers during the period studied.
The Lucile Packard Foundation for Children’s Health commissioned Kenneth Land,
Ph.D., of Duke University to create the California Index of Child and Youth Well-Being.
The composite index is modeled after Dr. Land’s national Child and Youth Well-Being
Index.
Posted by Andy Krackov
Tags: Data Projects
KIDSCOUNT DataBook Ranks California 20th
According to Annie E. Casey Foundation’s 2009 KIDSCOUNT DataBook, California ranks 20th in terms of how children are faring. The annual DataBook profiles the well-being of America’s children on a state-by-state basis and ranks states on 10 key measures. Accompanying the DataBook, KIDSCOUNT released an essay on the importance of making data-driven decisions regarding children. View the DataBook profile for California.
Many of the indicators noted in the DataBook also are available on kidsdata.org for your community. These include infant mortality, child deaths, teen births and poverty, among others.
Children Now, KIDSCOUNT’s California partner, offers a state analysis of the Data Book on their site.
Posted by Felicity Simmons
Tags: Data Projects


