Preteen Vaccine Week: Keeping the Spotlight on Adolescent Immunizations
This guest post was written by Jeff Good, PharmD, MPH, President of the California Immunization Coalition.
In 2011, a new school immunization mandate went into effect in California, requiring adolescents to provide proof that they have received a tetanus, diphtheria, and acellular pertussis (Tdap) vaccine to attend school. The new mandate increased Tdap vaccination rates and put a spotlight on the important role that immunizations play in keeping adolescents healthy. It also called attention to the fact that adolescent immunization rates in California remain low, leaving hundreds of thousands of adolescents vulnerable to diseases that can be serious, including pertussis, meningococcal disease, and human papillomavirus-related cancers.
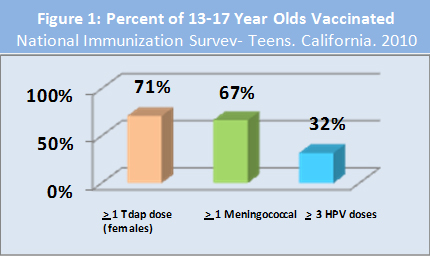
Immunization coverage levels in California fell far below the national Healthy People 2020 target of 80%. In 2010, only 67% of California’s adolescents had received a dose of meningococcal vaccine; 71% had received a Tdap vaccine; and only 32% of females had received the 3 doses of HPV4 vaccine recommended to protect against genital warts, cervical cancer, and other cancers (Figure1).
The recognition that adolescent immunization rates are low has invigorated the efforts of health, adolescent, and immunization stakeholders to increase awareness about adolescent immunizations, improve office-based immunization systems, and link families with low-cost and no-cost vaccinations. Join the California Immunization Coalition and its partners in celebrating Preteen Vaccine Week (February 12-18, 2012). This campaign is an opportune time to increase immunization awareness and test new strategies to:
- encourage parents and providers to schedule a comprehensive preventive visit for all preteens at 11-12 years of age to provide recommended immunizations and discuss other preventive health recommendations
- encourage providers to use proven systems to bring adolescents into the office and reduce missed opportunities to vaccinate
- educate parents and teens about the importance of immunizations and the risks of skipping or delaying immunizations
- raise awareness about two new laws impacting adolescent immunizations and
- link families with resources that provide no-cost and low-cost immunizations.
To learn more about adolescent immunizations, school immunization requirements, and Preteen Vaccine Week, please review our issue brief and visit www.immunizeca.org and www.shotsforschool.org.
Posted by kidsdata.org
Post Comment
Congenital Heart Defect Awareness Week: February 7-14
Congenital Heart Defect Awareness Week runs from Tuesday, February 7 to February 14. Congenital Heart Defects are the most common birth defects, affecting nearly 1% of American newborns and an estimated 1.8 million American families. Unfortunately, they also are one of the most dangerous; Congenital Heart Defects are one of the leading causes of infant death in the United States.
California data show that the leading cause of infant mortality in 2007-09 was congenital malformations and abnormalities (which include congenital heart defects) at a rate of 1.3 deaths per 1,000 live births.
To learn more about Congenital Heart Disease, visit the Congenital Heart Information Network website.
Posted by kidsdata.org
Post Comment
Achievement Gap Between Rich and Poor Children Is Widening; Find Related CA Data
Recent analyses of long-term studies show that the educational achievement gap between white and black students has narrowed over the past 60 years, but the gap between rich and poor students has widened substantially over time.
The studies, highlighted in today’s New York Times, discuss possible reasons for the large gap in academic performance between socioeconomic groups. One possible explanation is that higher-income parents have the means to invest more in children’s extracurricular activities, such as musical instrument lessons and academic tutoring, which can contribute to increased educational success.
Kidsdata.org offers a number of education-related indicators including reading proficiency, by socioeconomic status.
Posted by Stacey Angeles
Post Comment
U.S. Teen Births Hit Lowest Rate in Years; See Animation of CA Data
A report released today by the Guttmacher Institute shows that teen pregnancy rates in the U.S. have reached their lowest level in 40 years and that the nation’s teen birth rate declined by 35% from 1991 to 2008. A recent NPR article covers the report, highlighting that 7 percent of U.S. girls between ages 15 and 19 were pregnant in 2008, compared to 11 percent in 1990.
We recently updated teen birth data on kidsdata.org. These data show that California mirrors this nationwide trend with a nearly 50% decrease statewide in teen birth rates between ‘95 and ’09.
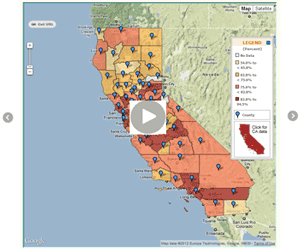
Want to see a visual display of declining teen birth rates across California counties? This interactive motion chart highlights the change. First click the bar graph tab toward the top and then press play. Hint: To follow the progression of a particular county, change the “order” pull-down from “data” to alphabetical, and select your county in the right column.
Posted by kidsdata.org
Post Comment
The Work-Family Balance
 The fall 2011 issue of The Future of Children, Work and Family, focuses on the tensions many parents experience when juggling a career and family. Overall, the journal issue suggests expanding workplace and time flexibility; making work-family policies more equitable across the income scale; and increasing the role of child caretakers in the community tohelp relieve pressures on family caregivers.
See the table of contents for the Work and Family issue >>
In California, parents of children with special health care needs experience particular work-life tensions. In fact, 24% of children with special health care needs had parents who cut back or stop working to care for their child, according to a federal survey, and that percentage grows to 45% if the family has public insurance.
See more data about the impact of children with special health care needs on families>>
Among all parents, family structure contributes to parents’ feelings of having adequate time for their families, an issue related to work-life balance. According to our foundation’s 2010 Parent Survey, 18% of California children have parents who report feeling they do not have enough time with their families; that percentage is higher for children in single-parent families (25%).
Posted by Stacey Angeles
Post Comment
Prenatal Care, Low Birthweight, Prematurity: How is CA Faring?
This July, two laws take effect in California requiring individual and small group health plans to provide coverage for maternity services, including prenatal care. This mandate could positively influence the overall health of children. Prenatal care greatly reduces the risk of infant mortality. Timely prenatal care also lowers the risk of premature birth and lower birthweight, both of which can leave babies at increased danger for long-term disabilities.
How is the state faring on these critical measures of infant health? As California approaches the enactment of these laws, newly posted data on kidsdata.org provide insight. See this kidsdata.org slideshow for details >>
Posted by kidsdata.org
Post Comment
Where Does CA Rank in New State Index of Child Well Being?
A new state-by-state index of child well being ranks California 30th overall in child well being, just ahead of neighboring Oregon and one behind Missouri. In order, the northeastern states of New Jersey, Massachusetts, and New Hampshire ranked best, according to this index from the Foundation for Child Development, while New Mexico came in last.
This index, a summary score from 25 individual indicators, is based off of the Foundation for Child Development’s national Child Well-Being Index, which was developed by Kenneth Land of Duke University. In 2009, our foundation commissioned Prof. Land to create the California Index of Child and Youth Well-Being.
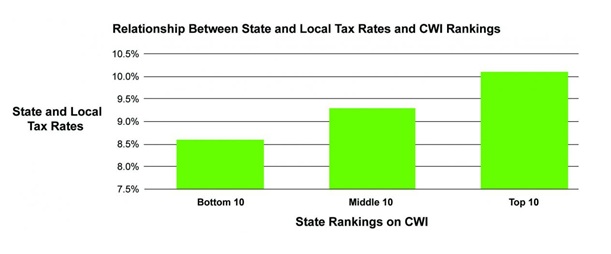
The Foundation for Child Development’s new State Child Well Being Index (CWI) also finds a strong correlation between state policies and children’s health, noting that states with higher tax rates “generate higher revenues and have higher CWI values than states with lower tax rates.”
Posted by Andy Krackov
Post Comment
Interactive Map Displays Distribution of Wealth in California
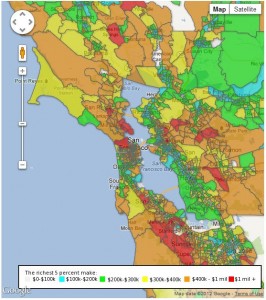
The Bay Citizen published this intriguing map on the distribution of California’s wealthiest neighborhoods. Ten of the richest areas are in San Mateo County, making it the county with the largest amount of wealthy neighborhoods in California. These hyper-local data, which provide income breakdowns for census tracts across the state, are based on 5-year estimates from the Census Bureau’s American Community Survey. See the level of wealth where you live>>
Related Data from Kidsdata.org:
Data on families’ ability to meet self-sufficiency standards>>
Posted by kidsdata.org
Post Comment
2011 Index on Child Well Being Notes Losses in Family Economics
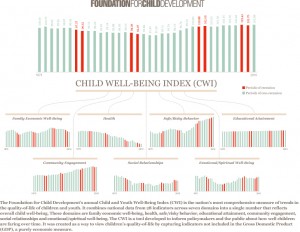
The Foundation for Child Development released its annual Child and Youth Well-Being Index for 2011. The index, compiled by Duke University’s Kenneth Land, provides a summary measure of how child well being has evolved over time in the U.S.
According to the 2011 index, children are struggling with social and economic instability. Some of the key findings from the report include:
- Families have lost all economic gains they’ve made since 1975, and are likely to continue losing ground.
- The percentage of children living in poverty stands to increase.
- There has been no substantial improvement in health insurance coverage for children. Seven million American children are still uninsured, and the number is growing.
- As additional funding from the Federal Stimulus Package ends, conditions may deteriorate further for children if federal and state governments don’t make investments to fill this gap.
In 2009, our foundation commissioned Prof. Land to create the California Index of Child and Youth Well-Being. See our index>>
Also see: Related data on kidsdata.org:
Posted by kidsdata.org
Post Comment
Some Recent Enhancements: Fact Sheets, Leg Map Overlays and Data Alerts
As we gear up for some large-scale enhancements to kidsdata.org in 2012, we thought we should highlight some recent improvements our foundation has made to the site, based on input from our users.
Legislative Map Overlays
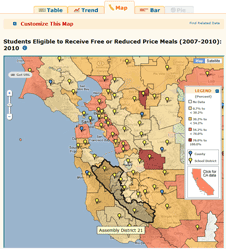
Last fall, we launched a mapping tool that makes it easy to overlay legislative district boundaries over other data sets. This tool allows you to select the data you want and then add legislative borders, so that you can visualize what’s happening in one or more Congressional, State Senate, and Assembly districts statewide. More info >>
See a step-by-step tutorial on how to use this legislative map overlay tool >>
One-Page Fact Sheets
One-page fact sheets now are available in an easy-to-print PDF format and provide a concise summary of data for each of our 60+ topics, 1,800 regions (every county, city, school district, and legislative district in California), and 10 demographic groups. The data summaries, designed to be one page (front and back), are populated with continually updated data, and are valuable for a variety of uses: Quick, up-to-date handouts about the status of children for meetings or advocacy work; inexpensive brochures for events and presentations; and offline reference material about children’s health in your community. More info >>
Data E-Mail Alerts
With e-mail alerts, you will know whenever data about kids in your community are updated on kidsdata.org. Only interested in children in Los Angeles? Or San Jose? Or Clovis Unified? Perhaps your work focuses on a particular topic — child abuse, or asthma, or education? Sign up to receive an e-mail alert from us as soon as data that you select are updated. More info >>
Policy Implication and Research Links
Because Kidsdata.org offers literally millions of data points, kidsdata.org added two sections to the website that put the data into context and offer options for taking action on issues. Policy Implications are summaries of evidence-based policy options for addressing issues. Research & Links provide key websites, additional research, and reports related to each topic. More Info>>
Stay tuned through this blog for news of other enhancements we’ll be adding to kidsdata.org in the coming year – and if you have any recommendations for features you’d like to see on this site, please add them as comments below.
Posted by kidsdata.org
Post Comment


