Report Details Recession’s Impact on U.S. Kids
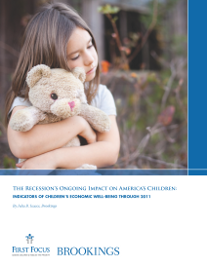
A new report published by the Brookings Institute discusses the economic toll of the recession on kids in California and throughout the United States. The data evaluated in the report, The Recession’s Ongoing Impact on America’s Children, is gathered by measuring three state-by-state indicators: children with an unemployed parent, individuals receiving nutrition assistance benefits, and child poverty.
According to the report, an estimated 6.5 million U.S. children under the age of 18 live in families where a parent was unemployed during at least one month of 2011, and more than 1 million of these children live in California.
Additionally, 8 million more children received supplemental nutritional assistance in 2011 than four years prior, indicating that children’s overall economic well-being has declined from 2010 to 2011.
Related Data on kidsdata.org:
• See more data about child homelessness >>
• See more data about family income and poverty >>
• See more data about unemployment >>
Posted by kidsdata.org
Post Comment
An In-Depth Look at Weight, Poverty, Special Ed, and Foster Care/Child Abuse
 Kidsdata.org, a program of the Lucile Packard Foundation for Children’s Health, has just posted Data Briefs on four key topics in children’s health. Each brief includes:
- Recent California/local data
- A description of the importance of the issue
- Links to related research
- A summary of high-level policy implications
These Data Briefs also include printable fact sheets on each topic.
Data recently posted to kidsdata.org show declining rates in California of both substantiated (verified) cases of child abuse/neglect and of first entries into foster care, both of which are important measures related to child welfare.
Free and Reduced Price School Meals
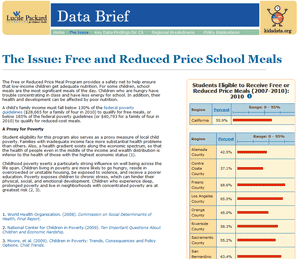
In almost every California county, the percentage of public school students eligible for the free or reduced price meal program increased from 2008 to 2010. More than 3.4 million California public school students in 2010 were eligible for this program, which is a proxy measure for poverty.
In California, the percentage of public school students meeting all six state fitness standards has improved over the last decade for 5th, 7th, and 9th graders. Despite these improvements, nearly 40 percent (38%) of 5th, 7th, and 9th graders in California were overweight or obese in 2010, and this prevalence largely held steady between 2005 and 2010.
About one in 10 California public school students was enrolled in special education in 2010 (11%), similar to recent years. Among the state’s 680,164 students in special education, learning disabilities and speech or language impairments are the most common disabilities.
Posted by kidsdata.org
Post Comment
A Link Between the Recession and Declines in California Births?
California recently released 2010 birth data, and the resulting news coverage noted a connection between the economic downturn and historically low birth rates.
Said the Sacramento Bee: “California’s birth rate tumbled last year to its lowest point since the Great Depression, new state figures show, yet another indication that the difficult economy is reshaping everyday life.”
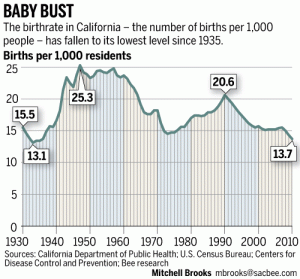
In 2010, there were 512,000 births across California, down 10% from 2007 (see related graph of birth rates over time in California). The decline in Latino birth rates is a driving force behind this trend. Birth rates among young Latina moms (under age 25) dropped by more than 20% from 2007 to 2010, “a seismic shift that normally takes decades,” according to the Sacramento Bee.
While the article plays up the connection between the recession and lower birth rates, demographers point to other causes, too, for this drop-off: children of immigrants have fewer kids than their parents did; couples now wait longer to start families; and the population in California is growing older.
Given all of these trends, state demographers predict historically low birth rates throughout the decade. Experts point out, though, that California’s population is still growing — partly a result of immigration — even if the growth is slower than it once was.
See related coverage in the Orange County Register.
Posted by kidsdata.org
Post Comment
Report Ranks California, Other States on Child Homelessness
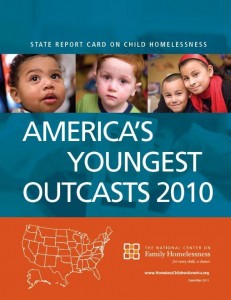
A new report published by the Campaign to End Child Homelessness ranks both U.S. states’ risk for child homelessness, as well as related state planning and policy activities. According to the report, America’s Youngest Outcasts, California is ranked at 46 overall alongside Arizona at 47 and New Mexico at 45 on a scale from 1-50, where Vermont ranked the best at number 1.
The report notes that an estimated 334,331 children were homeless in California in 2010. Although the state’s ranking has improved and the overall the number of homeless children has gone down since 2009, the data still indicate that a large number of California residents are unable to meet self-sufficiency standards. In the report’s risk of homelessness category, California ranks 38th, and the report indicates that California ranked 47th for home foreclosures.
Related Data on kidsdata.org:
• See more data about child homelessness >>
• See more data about family income and poverty >>
Posted by kidsdata.org
Post Comment
Our 10 Most Popular Data Releases of 2011
 We recently looked back at the most popular data releases on kidsdata in 2011, in terms of e-mail open rates. Below are the top 10. Does anything on this list surprise you?
- Asthma: How Many CA Kids Have Asthma? Find Data for Your Region
- Child Care: Released Today: New Child Care Data for All California Counties
- Data for Smaller Regions: Small Communities in CA: More Children’s Data Now Available
- Fitness: More CA Kids Meeting Fitness Standards: Find Local Data from ’10
- Health Care: New on Kidsdata: 2009 Data on Child Health Insurance and Doctor Visits
- School Enrollment: The New School Year – Find Local Enrollment and Other Education Data
- Self Sufficiency: What It Costs to Make Ends Meet for CA Families: Local 2011 Self-Sufficiency Data Now Available
- Truancies, Suspensions, and Expulsions: Local Data: How Many Students Are Truant, Suspended, or Expelled?
- Weight/Obesity: Just Updated: Kids’ Weight Data for Your Community
and
Are Childhood Obesity Rates Leveling Off? New Data Provide Insight
See the full list of data e-mail advisories from 2011: http://www.lpfch.org/programs/news.html
Coming up in early 2012: data on births and prental care/low birthweight.
Posted by kidsdata.org
Post Comment
December is National Impaired Driving Prevention Month
 On November 30th, 2011, President Obama proclaimed December as National Impaired Driving Prevention Month. The president shared this message:
“Though we have made progress in the fight to reduce drunk driving, our nation continues to suffer an unacceptable loss of life from traffic accidents that involve drugs, alcohol, and distracted driving. To bring an end to these heartbreaking outcomes, we must take action by promoting rigorous enforcement measures and effective substance abuse prevention programs. During National Impaired Driving Prevention Month, we recommit to preventing tragedy before it strikes by ensuring our family members and friends stay safe, sober, and drug-free on the road.”
Self-reported data on kidsdata for 2006 to 2008 indicate that more than 40% of 7th grade public school students in California have, on at least one occasion, ridden in a car with a driver who had been drinking. On that same survey, over 20% of 9th graders and over 25% of 11th graders reported that, at least once, they had driven after drinking or been in a car driven by a friend who had been drinking.
Kidsdata offers more data, too, on Alcohol, Tobacco, and Other Drugs, including Drinking and Driving or Riding with a Driver Who Had Been Drinking:
Posted by kidsdata.org
Post Comment
The Gift of Data
 |
Watch this video about the Top 5 Reasons to Use Kidsdata.org |
This holiday season, we want to honor the many organizations and individuals statewide who work on behalf of the 10,000,000 children in California. So in the spirit of giving, we note below the many ways in which Kidsdata – a public service from the Lucile Packard Foundation for Children’s Health – can help policymakers, researchers, advocates, nonprofits, and others who are committed to advancing and elevating the status of child health in California.
Kidsdata.org can be an invaluable resource for grant writing, program planning, community assessments, communications and advocacy work, policymaking, and many other initiatives.
Earlier this year, we blogged about the Top 5 Reasons to Use Kidsdata.org. In case you missed them, here they are again.
Kidsdata.org helps you…
- Use resources more efficiently by bringing together more than 35 trusted public data sources into one, free public service.
- Find and compare local data — for every city, county, and school district in California.
- Customize data for regions or demographic groups, and find the data display (map, bar graph, table, etc.) that works best for you.
- Share data instantly via social media, e-mail, or by downloading into Word, PowerPoint, or Excel.
- Stay up-to-date on new data for the children you serve via customized e-mail alerts, Kidsdata Advisory newsletters, Facebook and Twitter.
Learn how others have used kidsdata.org on our Kidsdata In Action page.
Posted by kidsdata.org
Post Comment
More Than 2 Million California Kids Live in Poverty, According to New Estimates
A recent report from the U.S. Census Bureau shows that California has over 2 million children (ages 0- 17) living in poverty.
According to 2010 estimates, 22% of the child population in California lives in poverty, up from 19.9% in 2009. In 2010, California alone accounted for 12.7% of all children in poverty in the United States.
Data also indicate racial and ethnic disparities in poverty persist in California. Data show that 32.2% of Black children and 30.2% of Hispanic children live in poverty, as compared to 19.9% of white children and 12.4% of Asian children.
Kidsdata has relevant data, including:
- The percentage of children in poverty:
- by City and County (250,000+ Residents) and by Race/Ethnicity, as single-year estimates
- by City, School District, and County (20,000+ Residents) and by Race/Ethnicity, as 3-year estimates
- by City, School District, and County (10,000+ Residents) and by Race/Ethnicity, as 5-year estimates
- by Legislative District (10,000+ Residents) and by Race/Ethnicity, as 5-year estimates
- The amount of money it takes for a family to be self-sufficient, by county and family composition
- The percentage of students eligible to receive free or reduced price meals, a proxy measure of child poverty.
- Ratings of the adequacy of family income to meet basic needs
Posted by kidsdata.org
Post Comment
Child Care Costs and the Family (and State) Budget
It cost California families on average $11,276 to enroll an infant in a licensed child care center in 2009; in some Bay Area counties, these average annual costs totaled $15,000 or more.
What’s the impact of those costs on a family budget? It’s heavy for many families, as $11,276 comes to about 15% of median family income in California ($67,038 in ’09), which also must cover other essentials such as housing, food, medical expenses and transportation.
Lower-income families feel the tightest pinch; $11,276 is more than half the income for a family that lives below the federal poverty level, which was $21,756 for a family of four in 2009. According to 2009 data, about 20% of California children lived in families below the federal poverty level, up from 17% in ’07.
These days, too, less governmental assistance is available in the form of subsidies or other programs. According to a June analysis from the California Budget Project, state budget cuts could translate to an estimated 60,000 children statewide losing access to child care and preschool due to cuts in funding for several programs and reductions in the income eligibility for child care services.
Just yesterday, the Sacramento Bee reported that if state revenue forecasts released this week are $1 billion below this summer’s budget assumptions, child care funding, among other programs, will be slashed by $23 million, on top of the $412 million in child care reductions from this summer.
More information on policy implications related to child care are available on kidsdata.org.
Posted by kidsdata.org
Post Comment
What’s the Leading Cause of Death Among Children/Youth in California?
What’s the most common cause of death for children and youth in California? Suicide? Cancer? Homicide? It’s actually unintentional injuries – accidents. Among all the leading causes of death, accidents consistently are the top cause of death for California children and youth ages 1-24 – and unintentional injury death rates are highest for 15-to 24-year-olds.
Over the past decade, from 2000 to 2009, 17,430 of California’s children and youth ages 1–24 have died as a result of accidents.
It’s not just a California issue, of course. In the U.S., the leading cause of death for children/youth also is unintentional injury. More specifically, drowning is the national leading cause of accidental death among children ages 1-4, but among older children and youth (those ages 5-24), it is being an occupant in a motor vehicle crash. Homicide, suicide, cancer, heart disease, and congenital abnormalities also make up the leading causes of death for 1- to 24-year-olds.
The newly updated child death data on kidsdata.org point to some encouraging signs. The unintentional injury death rate declined from ’96-’98 to ’07-’09 for child/youth age groups in the state, except for 20-to 24-year-olds. But according to the most recent data, accidents remain the leading cause of death for children/youth. In 2009 alone, nearly 1,400 California children and youth ages 1-24 died as a result of accidents, a number that highlights the need for continued public education and policies to reduce preventable deaths. For more information on what can be done, see the California Injury Prevention Network and SafeKids USA. Kidsdata.org also offers Policy Implications related to child deaths overall, as well as listings of websites and key reports.
Posted by kidsdata.org
Post Comment


