


October is National Bullying Prevention Month
 This October, help raise awareness about National Bullying Prevention Month. According to the National Bullying Prevention Center, sponsored by the Pacer Center, physical, verbal, and cyber abuse are all forms of bullying. Data from kidsdata were recently used at the Stop Bullying Summit in San Francisco, hosted by U.S. Attorney Melinda Haag, San Francisco Mayor Ed Lee, State Superintendent of Public Instruction Tom Torlakson, and San Francisco Superintendent of Schools Richard Carranza. The summit covered the effects of bullying on young people and their families, the role of government in creating a healthy and safe school climate, and how to engage the community in bullying prevention. Data from kidsdata.org shed light on this issue for California’s children and youth.
In 2008-2010, 42% of 7th graders in California reported being bullied or harassed at school within the past year. In this same time frame, 35% of 9th graders and 28% of 11th graders in California reported being bullied.
California youth are bullied for varying reasons. Data show that, in 2008-2010, 19% of 7th graders, 17% of 9th graders, and 14% of 11th graders in California reported being bullied based on their race. Within these two years, 8-12% of California 7th, 9th, and 11th graders reported being bullied due to their sexual orientation and 4-6% of students reported being bullied because of their disability.
If you, a family member, or someone you know is being subjected to bullying, seek help and/or notify authorities using these guidelines.
Posted by Lindsey Nguyen
Post Comment
News Roundup of Recent Stores: Childhood Obesity, Teen Health, and More
Following are some recent news highlights about children and families, along with related data from kidsdata.org: 
Childhood Obesity (see related data):
- Obese African American Children at Higher Risk for Hypertension than Obese White Children, Research Shows
(HealthDay, 9/21/12, by Gray)
- Obese Kids as Young as 6 May Be at Risk for Heart Issues, Research Finds
(WebMD, 9/25/12, by Boyles)
Nutrition and Physical Fitness (see related data):
- California Lunches for Low-Income Children Get More Healthful
(Healthycal.org, 10/2/12, by Flores)
- Institute of Medicine Suggests Using Different Tests to Gauge Kids’ Fitness
(MedPage, 9/27/12, by Pittman)
- Study: Children Ages 2-19 Consume 7 Trillion Calories from Sugar-Sweetened Drinks Per Year
(Scientific American, 9/27/12)
- Study: Untreated Food Allergies More Likely in Poor, Minority Children
(U.S. News, 9/21/12)
- CDC: U.S. Kids Eat Nearly As Much Salt As Adults, Leading to Health Risks
(NPR, 9/17/12, by Aubrey)
Teen Health (see related data):
- Texting Linked to Rise in Pedestrian Injuries and Deaths Among Teens, Study Finds
(NBC News, 9/23/12, by Urist)
- CDC: Teens Who Report Drinking and Driving Down 54% from 1991
(LA Times, 10/1/12, by Brown)
- Report: Poor Sleep in Teens Linked to Increased Risk of Heart Problems Later in Life
(Reuters, 10/2/12, by Norton)
- Teens Not Drawn to Danger, Just Have Tolerance for Risk Uncertainty, Study Finds
(HealthDay, 10/1/12, by Gray)
Posted by kidsdata.org
Post Comment
The Federal Budget Challenge: Can You Balance Our Country’s Budget?
 For those who enjoyed Next 10’s last challenge of balancing California’s state budget, the nonpartisan organization presents an even more daunting task: balancing the United States’ federal budget. In the updated Federal Budget Challenge, challengers must make tough decisions on issues such as military spending and tax reform, with the looming reality of a national $2.3 trillion starting deficit. The same rules apply, but this time your decisions would affect the entire U.S., as well as our relationships with other nations.
If you are up for this budget challenge, try it yourself here.
Posted by kidsdata.org
Post Comment
Childhood Cancer and Leukemia & Lymphoma Awareness Month

September marks both Childhood Cancer Awareness Month and Leukemia & Lymphoma Awareness Month. Below are some key data points worth noting in recognition of these health observances.
From 2005 to 2009, more than 9,000 California children ages 0-19 were diagnosed with cancer, according to data from kidsdata.org. The state’s rate of childhood cancer diagnoses increased from 16.4 per 100,000 ages 0-19 in 2001-2004 to 17.4 in 2005-2009.
Data over the last decade show that Caucasian youth ages 0-19 have had the highest rate of cancer diagnoses: 18.6 per 100,000 in 2005-2009. Caucasian youth also have had the highest five-year survival rate, at 83% during 1999-2009 (see survival rate definition).
Leukemia remains the most common type of cancer among California children.
See updated data for Childhood Cancer Awareness Month in our recent advisory.
See more data on childhood cancer and related topics.
Also See: Printable one-page overview on childhood cancer in California.
Posted by Lindsey Nguyen
Post Comment
Stanford Center Analyzes California Children’s Services (CCS) Data to Help Improve Quality, Efficiency of Care
A guest post from Lee M. Sanders, MD, MPH
General Pediatrics, Center for Policy Outcomes and Prevention
Stanford University
National and state reforms to health-care delivery – largely designed to improve care for older Americans – may inadvertently exacerbate health disparities for the youngest Americans. Nowhere is this danger greater than for children with complex health conditions who live at or near poverty.
California Children’s Services (CCS), designed specifically to provide high-quality subspecialty care and care coordination for these children, uses federal funding from public health insurance (Medicaid, CHIP) and supplemental health funding (Title V of the Social Security Act) to serve more than 150,000 children in California who fit these criteria.
At the Stanford Center for Policy Outcomes and Prevention, we are committed to providing rigorous and transparent analysis of the CCS program, to help guide policymakers, clinicians and families in their efforts to continue to improve the quality and efficiency of care for this vulnerable population. We are pursuing this research in collaboration with the California CCS program, as well as other statewide stakeholders. Using CCS administrative databases, we have already uncovered patterns of variability in program enrollment, health-care use, and health-care costs – all of which have been shared with program leaders and continue to inform their programmatic decisions.
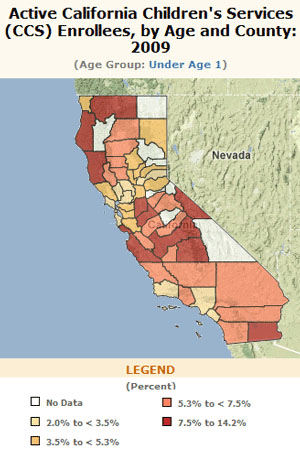
In addition to the enrollment data made available publicly through kidsdata.org, we are continuing to work with our statewide partners to explore other, more detailed analyses, in order to answer more specific questions. These include: What are the unique patterns of care use by the few children (10 percent) in whom CCS invests the majority of its funding? What is the differential burden of congenital and acquired chronic illness to the state’s health care system? What do these patterns tell us about opportunities to improve the quality of delivery of care? What do they tell us about opportunities to improve the value or efficiency of care? Are there significant variations in the use of care by children with specific diagnoses for which there are established national quality indicators?
We hope to provide answers to these questions soon. Please contact us at [email protected] with any questions or recommendations for this research. Our goal is to maintain its clinical and policy relevance for real-world action.
Posted by kidsdata.org
Post Comment
News Roundup of Recent Stories: Palliative Care, Asthma, Vaccines
Following are some recent news highlights about children and families, along with related data from kidsdata.org:
Palliative Care (see related data):
- Palliative Care Agency Provides In-Home Assistance to Children
(Healthycal.org, 8/7/12, by Flores) - UCLA Study: Pilot Medi-Cal Program Reduces Hospital Time and Costs, and Increases Quality of Life for Children and Families
(LA Times, 8/29/12, by Knoll)
Asthma (see related data):
- Asthma-Resistant Therapy May Be Caused by Poor Adherence to Therapy, Environment
(Family Practice News, 8/28/12, by Boschert) - Study: Child’s Risk of Asthma Associated with Smoking During Pregnancy
(HealthDay News, 8/22/12, by Dotinga) - Study: Asthma Risk Associated with Exposure to Certain Types of Mold
(HealthDay News, 8/10/12, by Dallas) - Common Asthma Drug May Help Children with Sleep Apnea
(Web MD, 8/7/12, by Mann)
Vaccines (see related data):
- Bill to Make Acquiring Vaccine Exemption More Strict Passes California Senate, Moves to Assembly
(KQED, 8/23/12, by Aliferis) - Whooping Cough Vaccination Required for Incoming California 7th Graders
(Bay Citizen, 8/3/12, by Lin) - Report: Most U.S. Kindergartners Get Vaccines, but Unvaccinated Children Still Cause Health Risks
(Reuters, 8/23/12, by Beasley)
Posted by Stacey Angeles
Post Comment
National Immunization Awareness Month
 August is National Immunization Awareness Month. Immunizations are among the most successful and cost-effective preventive health care interventions, according to the U.S. Department of Health and Human Services.
In California, the three counties with the highest percentage of kindergarteners who received all immunizations required for admission to school in 2010 include Colusa County (96.5%), Tulare County (96.4%), and Kings County (96.2%), according to kidsdata.org.
Other counties, however, had immunization percentages that were much lower. In some counties, less than 75% of kindergarteners received all required immunizations. See immunization data by county>>
View this one page printable fact sheet to learn more about immunizations in California.
To help inform parents and children about immunization, the Centers for Disease Control and Prevention has provided downloadable fact sheets, flyers, and immunization schedules for children and teens.
See related data:
– Kindergarteners with all Required Immunizations 2010
– Why Immunization is Important
Posted by Lindsey Nguyen
Post Comment
Data by County: The State of Children’s Health
 The UCLA Center for Health Policy Research just released printable one-page profiles on child and teen health in California counties. The downloadable PDF summaries provide easy-to-read snapshots about children’s health for every county, using 2009 data from the California Health Interview Survey. These summaries provide numbers on childhood and teen obesity, asthma, how often children engaged in physical activity, and more.
For more easy-to-use data on key health indicators for kids, view PDF summaries for a variety of topics provided by kidsdata.org.
Posted by kidsdata.org
Post Comment
A Snapshot of Children’s Physical Fitness in California
A look at kidsdata.org shows that 38% of all California 5th, 7th, and 9th graders were considered overweight or obese in 2010 according to federal standards.
In addition, only 32% of California 7th graders met all fitness standards in 2011. In order to meet the standards of the California Fitness Test, students must score in the “Healthy Fitness Zone” on 6 out of 6 tests. According to our recent weight and fitness data advisory, 25% of 5th graders, 32% of 7th graders, and 37% of 9th graders met all state fitness standards.
Despite these statistics, severe budget constraints have meant that many California schools have cut gym classes from their budgets or are considering doing so, according to an article by New American Media.
Physical activity is vital for children. Regular exercise helps build healthy bones and muscles, lowers the risk of becoming obese, and promotes overall psychological and physical well-being, according to the Centers for Disease Control and Prevention. Kids who exercise at an early age also increase their odds at maintaining this healthy habit as adults.
See related data on kidsdata.org:
– Students Meeting All Fitness Standards by Grade Level: 2011
– Overweight/Obese Students (Federal Definition): 2010
– Weight and Fitness Data for Students in Your Community Advisory 2012
Posted by Lindsey Nguyen
Post Comment
The California Budget Challenge
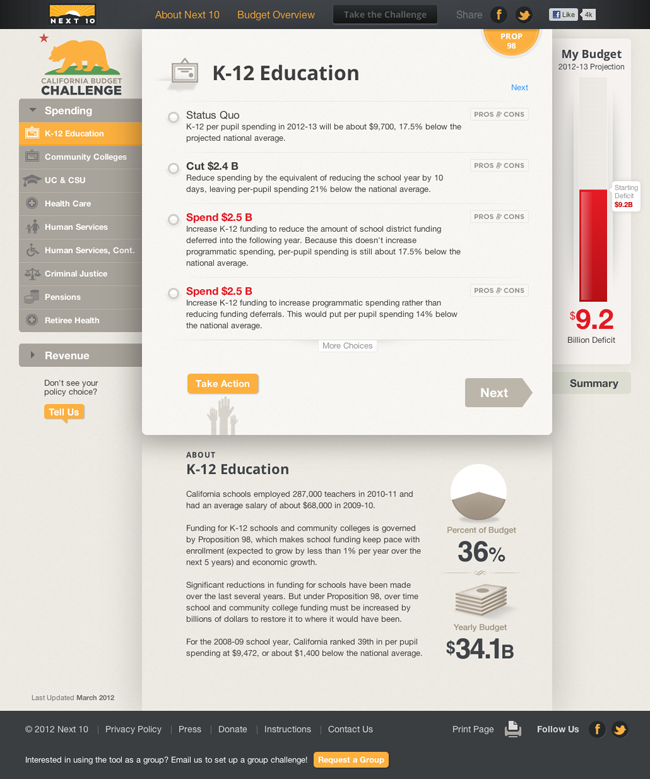 Next 10, a nonpartisan organization dedicated to educating the public about state policies and civic engagement in California, has released the updated California Budget Challenge: an interactive, online tool that allows users to allocate the state’s funds as they see fit while also keeping in mind how to finance their decisions.
This year’s budget balancing tool is sleek and easy to navigate, but the challenge itself is a difficult task. With a $15.7 billion starting deficit, the introduction of voter propositions, and the ability to see how your decisions would affect California citizens in real-time, the challenge is much harder than at first glance. This, however, is all part of Next 10’s effort to make the tool resemble the real process of creating the 2012-2013 California state budget.
There are more than 10 sections of the budget that users must work with to make spending and revenue-increasing decisions. Users can analyze four or more options to “cut” or “spend” any section of the budget or, if they prefer, to keep the ongoing policy. A detailed summary about the section, voter propositions, and a “pros and cons” tab helps users weigh their options. Depending on what you choose, a red bar will indicate an increase or decrease to the deficit. Users also can dip into the reserve if they believe all of their decisions are necessary. Not only is this an interesting, fun way to see how balancing our state budget works, but also it is an engaging way to learn more about state policies—what they are, why they are important, and whom they affect.
If users are happy with their final budget, they can choose to send their proposed solutions to California’s elected officials.
Think you’re up for the challenge? Give it a try here.
Posted by Lindsey Nguyen
Post Comment