2012 Children Now Scorecard Ranks Child Health Indicators in California Counties
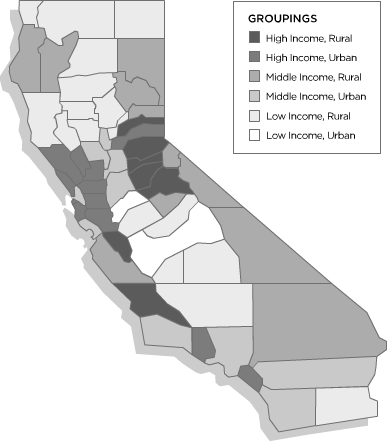
 The 2012 California County Scorecard on the state of children’s health has been published for all 58 counties in California. Created by Children Now, a national organization focused on making children’s health a top priority for policymakers and the public, this report allows users to explore data by topics broken down by income level, living area, and race/ethnicity.
With 28 different key indicators ranging from “young children who read every day” to “asthmatic children who have been given an asthma management plan,” this report also lets users organize each indicator by each topic.
This scorecard is an important tool in assessing the needs of California’s children.
For more data on children’s health, explore kidsdata.org by topic.
Posted by Lindsey Nguyen
Post Comment
News Roundup of Recent Stories: Autism, Health Disparities, and More
Following are some recent news highlights about children and families, along with related data from kidsdata.org: 
Children with Autism (see related data):
- San Francisco Prepares for Wave of Autistic Adults
(SF Chronicle, 10/4/12, by Allday)
- Study: Half of Children with Autism Wander from Caregivers, Increasing Risk of Accidents and Injury
(MedPage Today, 10/8/12, by Phend)
- Daily Yoga Found to Improve Classroom Behavior of Kids with Autism
(NPR, 10/12/12, by Barclay)
Poverty, Disparities, and Child Health (see related data):
- The U.S. Budget and the Fate of Children
(NY Times, 10/9/12, by Porter)
- CDC Reports Child Poverty Is High, Families Continue to Struggle
(Huffington Post, 9/28/12, by Edelman)
- Disparities Persist in Children’s Well-Being, According to Health Report Card
(Bay Citizen, 10/10/12, by Lin)
Also See: http://www.californiahealthline.org/articles/2012/10/9/study-calif-childrens-health-well-being-varies-based-on-location.aspx
http://www.mercurynews.com/census/ci_21727930/health-well-being-californias-children-varies-widely-based
Child Abuse and Neglect (see related data)
- Study: Child Hospitalizations for Physical Abuse Increased 5% Over Past 12 Years
(Futurity.org, 10/2/12, by Yale)
- Eye Injury Examinations May Be Used to Distinguish Accidental Head Injuries from Child Abuse of Infants and Toddlers, Research Finds
(HealthDay, 10/8/12, by Dotinga)
Environmental Health (see related data):
- Study: Traffic Pollution May Cause Long-Term Lung Damage to Children
(Healthline, 10/12/12, by Severson)
- Report: Pesticides Related to Increase in Serious Health Problems Among Children
(SF Chronicle, 10/9/12, by Lee)
- Survey: Thousands of Kids at Risk for Lead Poisoning May Not Get Treatment Due to Budget Cuts
(USA Today, 10/2/12, by Ridel)
Posted by Roselyn Thomas
Post Comment
Bring Awareness to Youth Substance Abuse Issues with Red Ribbon Week

October 23 to October 31 marks Red Ribbon Week. Founded and sponsored by the National Family Partnership, Red Ribbon Week serves to raise awareness about substance abuse, especially in youth and teens. Kidsdata.org has a variety of indicators on youth substance abuse in California.
A notable 40% reported using alcohol or other drugs in the past month, according to data from 2008-2010. In this same time frame, 46% of California 9th graders and 62% of 11th graders reported having at least 1 full drink of alcohol in their lives.
About 13% of California 7th graders reported using inhalants at least once in their lives, 2008 to 2010 data show. These data exclude cigarette use from 2008 to 2010, which is separated by grade level and county here.
View related data on drug abuse here.
Posted by Lindsey Nguyen
Post Comment
New Video from California Budget Bites: California Recovery and Single Mothers
A new online video from the California Budget Project documents how single mothers in the state are faring in the wake of the Great Recession. While the state’s job market has begun to recover, single mothers continue to experience challenges in finding employment and earning adequate income.
Almost 23 percent of California’s children live in households headed by mothers, according to 2007-2009 estimates on kidsdata.org. The percentage of such households varies by race/ethnicity; 13.2% of Asian American households with children were headed by single mothers, but that figure climbs to 32.1% for Native Americans and 51.5% for African American/Black households with children. Previous research has shown that family structure and the nature of the family relationships, in particular, are important factors in child development. For example, single-parent headed households are more likely to have lower incomes and to experience financial hardship than two-parent households. Find out more about the connection between family structure and child wellbeing at kidsdata.org.
The video is the latest in a California Budget Project series that aims to highlight key issues and trends in the state’s budget policy.
Posted by Roselyn Thomas
Post Comment
October is National Bullying Prevention Month
 This October, help raise awareness about National Bullying Prevention Month. According to the National Bullying Prevention Center, sponsored by the Pacer Center, physical, verbal, and cyber abuse are all forms of bullying. Data from kidsdata were recently used at the Stop Bullying Summit in San Francisco, hosted by U.S. Attorney Melinda Haag, San Francisco Mayor Ed Lee, State Superintendent of Public Instruction Tom Torlakson, and San Francisco Superintendent of Schools Richard Carranza. The summit covered the effects of bullying on young people and their families, the role of government in creating a healthy and safe school climate, and how to engage the community in bullying prevention. Data from kidsdata.org shed light on this issue for California’s children and youth.
In 2008-2010, 42% of 7th graders in California reported being bullied or harassed at school within the past year. In this same time frame, 35% of 9th graders and 28% of 11th graders in California reported being bullied.
California youth are bullied for varying reasons. Data show that, in 2008-2010, 19% of 7th graders, 17% of 9th graders, and 14% of 11th graders in California reported being bullied based on their race. Within these two years, 8-12% of California 7th, 9th, and 11th graders reported being bullied due to their sexual orientation and 4-6% of students reported being bullied because of their disability.
If you, a family member, or someone you know is being subjected to bullying, seek help and/or notify authorities using these guidelines.
Posted by Lindsey Nguyen
Post Comment
News Roundup of Recent Stores: Childhood Obesity, Teen Health, and More
Following are some recent news highlights about children and families, along with related data from kidsdata.org: 
Childhood Obesity (see related data):
- Obese African American Children at Higher Risk for Hypertension than Obese White Children, Research Shows
(HealthDay, 9/21/12, by Gray)
- Obese Kids as Young as 6 May Be at Risk for Heart Issues, Research Finds
(WebMD, 9/25/12, by Boyles)
Nutrition and Physical Fitness (see related data):
- California Lunches for Low-Income Children Get More Healthful
(Healthycal.org, 10/2/12, by Flores)
- Institute of Medicine Suggests Using Different Tests to Gauge Kids’ Fitness
(MedPage, 9/27/12, by Pittman)
- Study: Children Ages 2-19 Consume 7 Trillion Calories from Sugar-Sweetened Drinks Per Year
(Scientific American, 9/27/12)
- Study: Untreated Food Allergies More Likely in Poor, Minority Children
(U.S. News, 9/21/12)
- CDC: U.S. Kids Eat Nearly As Much Salt As Adults, Leading to Health Risks
(NPR, 9/17/12, by Aubrey)
Teen Health (see related data):
- Texting Linked to Rise in Pedestrian Injuries and Deaths Among Teens, Study Finds
(NBC News, 9/23/12, by Urist)
- CDC: Teens Who Report Drinking and Driving Down 54% from 1991
(LA Times, 10/1/12, by Brown)
- Report: Poor Sleep in Teens Linked to Increased Risk of Heart Problems Later in Life
(Reuters, 10/2/12, by Norton)
- Teens Not Drawn to Danger, Just Have Tolerance for Risk Uncertainty, Study Finds
(HealthDay, 10/1/12, by Gray)
Posted by kidsdata.org
Post Comment
The Federal Budget Challenge: Can You Balance Our Country’s Budget?
 For those who enjoyed Next 10’s last challenge of balancing California’s state budget, the nonpartisan organization presents an even more daunting task: balancing the United States’ federal budget. In the updated Federal Budget Challenge, challengers must make tough decisions on issues such as military spending and tax reform, with the looming reality of a national $2.3 trillion starting deficit. The same rules apply, but this time your decisions would affect the entire U.S., as well as our relationships with other nations.
If you are up for this budget challenge, try it yourself here.
Posted by kidsdata.org
Post Comment
Childhood Cancer and Leukemia & Lymphoma Awareness Month

September marks both Childhood Cancer Awareness Month and Leukemia & Lymphoma Awareness Month. Below are some key data points worth noting in recognition of these health observances.
From 2005 to 2009, more than 9,000 California children ages 0-19 were diagnosed with cancer, according to data from kidsdata.org. The state’s rate of childhood cancer diagnoses increased from 16.4 per 100,000 ages 0-19 in 2001-2004 to 17.4 in 2005-2009.
Data over the last decade show that Caucasian youth ages 0-19 have had the highest rate of cancer diagnoses: 18.6 per 100,000 in 2005-2009. Caucasian youth also have had the highest five-year survival rate, at 83% during 1999-2009 (see survival rate definition).
Leukemia remains the most common type of cancer among California children.
See updated data for Childhood Cancer Awareness Month in our recent advisory.
See more data on childhood cancer and related topics.
Also See: Printable one-page overview on childhood cancer in California.
Posted by Lindsey Nguyen
Post Comment
Stanford Center Analyzes California Children’s Services (CCS) Data to Help Improve Quality, Efficiency of Care
A guest post from Lee M. Sanders, MD, MPH
General Pediatrics, Center for Policy Outcomes and Prevention
Stanford University
National and state reforms to health-care delivery – largely designed to improve care for older Americans – may inadvertently exacerbate health disparities for the youngest Americans. Nowhere is this danger greater than for children with complex health conditions who live at or near poverty.
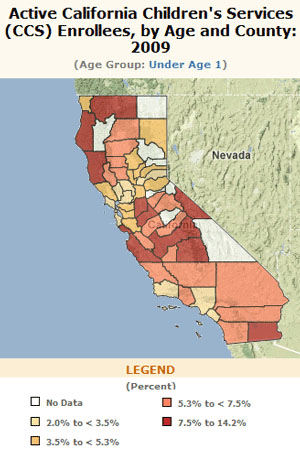
California Children’s Services (CCS), designed specifically to provide high-quality subspecialty care and care coordination for these children, uses federal funding from public health insurance (Medicaid, CHIP) and supplemental health funding (Title V of the Social Security Act) to serve more than 150,000 children in California who fit these criteria.
At the Stanford Center for Policy Outcomes and Prevention, we are committed to providing rigorous and transparent analysis of the CCS program, to help guide policymakers, clinicians and families in their efforts to continue to improve the quality and efficiency of care for this vulnerable population. We are pursuing this research in collaboration with the California CCS program, as well as other statewide stakeholders. Using CCS administrative databases, we have already uncovered patterns of variability in program enrollment, health-care use, and health-care costs – all of which have been shared with program leaders and continue to inform their programmatic decisions.
In addition to the enrollment data made available publicly through kidsdata.org, we are continuing to work with our statewide partners to explore other, more detailed analyses, in order to answer more specific questions. These include: What are the unique patterns of care use by the few children (10 percent) in whom CCS invests the majority of its funding? What is the differential burden of congenital and acquired chronic illness to the state’s health care system? What do these patterns tell us about opportunities to improve the quality of delivery of care? What do they tell us about opportunities to improve the value or efficiency of care? Are there significant variations in the use of care by children with specific diagnoses for which there are established national quality indicators?
We hope to provide answers to these questions soon. Please contact us at [email protected] with any questions or recommendations for this research. Our goal is to maintain its clinical and policy relevance for real-world action.
Posted by kidsdata.org
Post Comment
News Roundup of Recent Stories: Palliative Care, Asthma, Vaccines
Following are some recent news highlights about children and families, along with related data from kidsdata.org:
Palliative Care (see related data):
- Palliative Care Agency Provides In-Home Assistance to Children
(Healthycal.org, 8/7/12, by Flores) - UCLA Study: Pilot Medi-Cal Program Reduces Hospital Time and Costs, and Increases Quality of Life for Children and Families
(LA Times, 8/29/12, by Knoll)
Asthma (see related data):
- Asthma-Resistant Therapy May Be Caused by Poor Adherence to Therapy, Environment
(Family Practice News, 8/28/12, by Boschert) - Study: Child’s Risk of Asthma Associated with Smoking During Pregnancy
(HealthDay News, 8/22/12, by Dotinga) - Study: Asthma Risk Associated with Exposure to Certain Types of Mold
(HealthDay News, 8/10/12, by Dallas) - Common Asthma Drug May Help Children with Sleep Apnea
(Web MD, 8/7/12, by Mann)
Vaccines (see related data):
- Bill to Make Acquiring Vaccine Exemption More Strict Passes California Senate, Moves to Assembly
(KQED, 8/23/12, by Aliferis) - Whooping Cough Vaccination Required for Incoming California 7th Graders
(Bay Citizen, 8/3/12, by Lin) - Report: Most U.S. Kindergartners Get Vaccines, but Unvaccinated Children Still Cause Health Risks
(Reuters, 8/23/12, by Beasley)
Posted by Stacey Angeles
Post Comment


