Posts Tagged ‘New Data’
Fewer Than One in Three Students Proficient in Algebra I
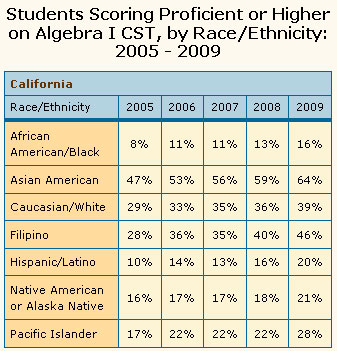 Over the past four years, California has seen Algebra I proficiency increase among students in grades 7-11, but the stubborn fact remains that fewer than one in three students is considered proficient.
Research has shown that competence in mathematics is crucial for functioning in everyday life, and mastering algebra is associated with readiness for the workplace and higher future earnings.
Disparities by race/ethnicity and socioceconomic status are pronounced. Statewide, Asians are four times more likely to be proficient in Algebra I than African Americans, and three times more likely to be proficient than Hispanics.
While such gaps between different socioeconomic and ethnic groups have long existed not only in California, but nationwide, a recent report indicates that some schools are having success reducing the math achievement gap.
What kinds of strategies does your school or district use?
Posted by kidsdata.org
Tags: New Data, Statewide Expansion
Despite Steady Increases Statewide, Fewer than Half of CA Third Graders Proficient at Reading
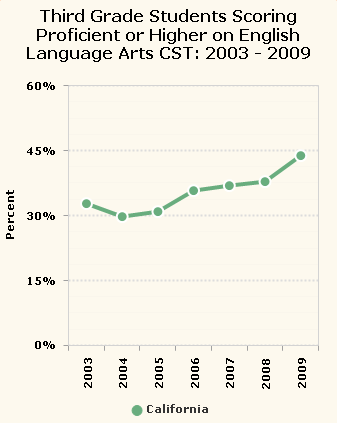 One of the leading indicators of students’ academic progress and likely school success is their level of reading at the end of third grade. In California, although steady increases in reading proficiency have been seen since 2005 across all ethnic and socioeconomic groups, fewer than half of California third graders score proficient or higher on the state’s English language standardized test.
Despite increases in reading proficiency across all groups, substantial disparities remain. For instance, fewer than one in four Latino third graders read at or above the 50th percentile, the lowest of any racial/ethnic group in CA. These gaps also exist between low-income and higher-income students.
The Annie E. Casey Foundation also recently released a report, Early Warning! Why Reading by the End of Third Grade Matters, which notes that California ranks 46th in the percentage of 4th-graders who are not proficient in reading.
Children need a variety of support beginning at an early age in order to read proficiently by third grade. They must be ready to learn when they enter school, which means having access to opportunities to help them build basic cognitive, social, emotional and physical skills. Children who do not have access to such opportunities may need extra support to catch up; otherwise, they tend to fall further behind over time.
Do you see these trends in your school or district? Has your school or district found effective measures to help close these proficiency gaps?
Posted by kidsdata.org
Tags: New Data, Statewide Expansion
One in Three CA High School Graduates Ready for College
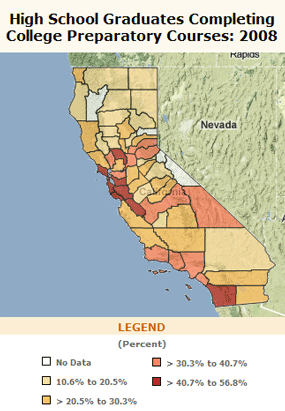
New college readiness data on kidsdata.org indicate that in 2008, about one in every three high school graduates was college ready – as measured by completion of college preparatory courses required for admission to the UC and CSU systems with a grade of “C” or better.
Looking specifically at counties and how they compare to the state average, the top five counties were all in the Bay Area.
Drilling down to specific parameters such as school districts and race/ethnicity, some wide disparities appear. At the school district level, college readiness ranges from two percent in some districts to more than 75 percent in others. Ethnically, 59 percent of Asian American students are ready for college, while African American and Hispanic students are both at 23 percent.
Are these numbers surprising to you? Without knowing the data, what percentage of high school graduates would you guess to be college ready?
Posted by kidsdata.org
Tags: New Data
2008 CA High School Dropouts Could Fill Two Baseball Stadiums
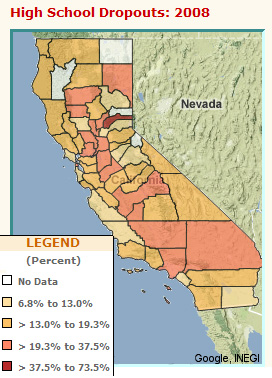 According to our recently released data on high school dropouts, in 2008 about one in five kids in California (19%) dropped out of high school during grades 9-12, a total of nearly 100,000. That’s down from 109,000 in 2007, but each year roughly 100,000 dropouts enter an already shaky California economy. To put those numbers into perspective, you could fill Anaheim’s Angel Stadium twice over with 2008 California dropouts, and still have nearly 10,000 more kids waiting outside.
Hispanics/Latinos, who represent 49% of California’s public school students, accounted for more than half of all dropouts (nearly 55,000). African American/Black students had the highest dropout percentage rate, with nearly one in three (32.9%) quitting school during grades 9-12. Asian Americans had the lowest rate, at 7.9 percent.
Educators nationwide share concern over dropouts, because they are more likely to use drugs and alcohol, get involved in criminal activity, and become teen parents.
What’s happening locally in your school district? Have you seen an increasing or decreasing trend in high school dropouts? What factors might be contributing to these trends in your community?
Posted by kidsdata.org
Tags: New Data, Statewide Expansion
Just Added to Kidsdata.org: Dating Violence and Teen Sexual Health Data
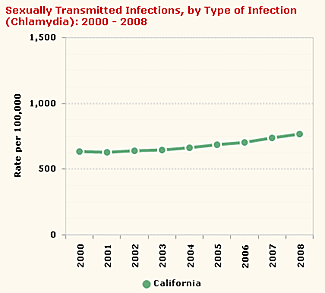 What do we know about dating and sexual health among California adolescents? Here are some highlights: Four out of five teens ages 14-17 say they have not had sex. About 5% of California’s 7th, 9th, and 11th-graders report that they have experienced physical violence in a dating relationship. And chlamydia rates among California’s youth ages 10-19 increased by roughly 20% from 2000 to 2008.
These and other local data on teen sexual health and dating violence now are available on kidsdata.org. Dating violence data come from the California Healthy Kids Survey (CHKS), a statewide survey of students that was developed and is administered by WestEd for the California Department of Education, while the teen sexual health data have two sources – the California Health Interview Survey and the California Department of Public Health.
View Local Data on Dating Violence and Teen Sexual Health
- Youth Experiencing Dating Violence in the Last Year – for School Districts Statewide
By Gender and Grade | By School Connectedness | By Race/Ethnicity
- Selected Facts About Dating Violence
- Teens Who Have Not Had Sex (data available only for CA’s 9 most populous counties)
- Selected Facts About Teen Sexual Health
Posted by kidsdata.org
Tags: New Data, Statewide Expansion
Just Added: Economic & Demographic Data for 750 Regions Statewide
This week, kidsdata.org adds important economic and demographic data for more than 750 regions across California. These indicators, from the Census Bureau’s American Community Survey (ACS), provide data for three-year periods on child population, immigration, family structure, family income , and poverty for counties, cities, and school districts statewide of 20,000 residents or more. ACS data for single years still are available on kidsdata.org for regions in California with more than 250,000 residents.
Find the New Demographic and Economic Data for Your Community:
-
Demographics: Child Population
-
Grandparents: Children in the Care of Grandparents
-
Households with Children: By Number | By Percent
-
Immigration: Foreign-Born Population, by Age Group
-
Income: Median Family Income
-
Poverty: Children in Poverty | By Race/Ethnicity
-
Single/Married Households: By Number | By Percent
Sign up to receive a customized e-mail alert when these and other data you select are updated.
Posted by kidsdata.org
Tags: New Data, Statewide Expansion
How Safe Do CA Youth Feel? Gangs, Bullying and School Safety Data Offer Insights
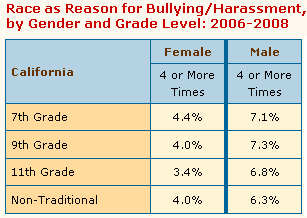 Kidsdata.org’s statewide expansion continues with new data for school districts statewide from the California Healthy Kids Survey (CHKS) specific to gang involvement, bullying, and school safety.
All three measures of youth safety play a crucial role in students’ overall health and well being. Safe school environments foster social and intellectual interactions required for a student’s academic achievement. Being bullied can cause extreme anxiety, and is linked to depression and thoughts of suicide. Gang members are responsible for the majority of serious violent crimes committed by youth, and they are more likely to be involved in selling drugs.
Insights from these newly posted data data:
- Race/national origin is the most common reason cited for bullying in schools. About 15 percent of female students and 20 percent of males in 2006-08 reported at least one incident of being bullied in the year prior to the survey for this reason.
- About 30% of California 7th graders in 2006-2008 say that at least one time in the year prior to the survey, they were afraid they would be beaten up at school.
- According to these 2006-08 data, Caucasian students in California feel safest at school (64 percent said they feel safe or very safe), and African American students are least likely to say they feel safe (50 percent).
- In California in 2006-08, about 8% of 7th, 9th, and 11th grade boys said they had brought a gun to school at least once in the year prior to the survey, and 3% said they brought a gun to school four or more times.
- In California in 2006-08, about 11 percent of boys in grades 7, 9, and 11 considered themselves a member of a gang; roughly 6-8 percent of girls said the same.
Posted by kidsdata.org
Tags: New Data, Statewide Expansion
How Connected Are CA Kids to their Schools?
As adults, we know that the health and success of a company depend, in part, on a positive working environment. When employees feel that their managers care, hold high expectations, and give meaning to their work, productivity increases.
This dynamic is similar in schools. Students want to feel valued, challenged, and encouraged to participate, and when they do, research has shown that these and other factors associated with school connectedness play a critical role in fostering resilience in kids. Resilience, in turn, has been associated with healthy development and the avoidance of risky behaviors.
But how do we measure a student’s connectedness to school? Over the past several years, the California Healthy Kids Survey (CHKS) – developed and administered by WestEd and the California Department of Education – has established a number of measures of school connectedness, and these data – broken out by gender and race/ethnicity – now are available on kidsdata.org for school districts for across California.
Among the highlights, these data from 2006-08 show that:
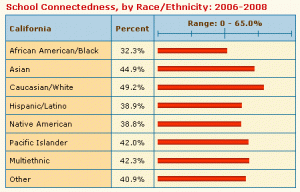 Less than half of 7th, 9th, and 11th-grade students in California typically report high levels of connection to their school. This summary measure includes student reports of being treated fairly, feeling close to people, feeling happy, feeling a part of, and feeling safe at, school.
- Students’ connectedness to school varies
by race/ethnicity. Caucasian/White and Asian American students consistently are most likely to report high levels of connectedness, while African American/Black students are least likely to report such high levels. - About one half of 7th, 9th, and 11th grade students in California in 2006-08 reported high expectations from teachers and others at school. Across all racial/ethnic groups, students were more likely to say in 2006-08 that teachers had high expectations of them than in 2003-’05.
- About 15% of 7th, 9th, and 11th-grade students in California report high levels of meaningful participation in school. This is a summary measure of student reports of whether at school they do interesting activities, help make decisions, and “do things that make a difference.” A higher percentage of students – roughly one-third – report low levels of meaningful participation in school.
These school connectedness data provide important insights on the emotional health of students, and now that they are on kidsdata.org, we hope they can help policy makers and school districts statewide craft ways to ensure that all students, regardless of gender and ethnicity, feel connected to their schools.
Posted by kidsdata.org
Tags: New Data, Statewide Expansion
Insights from Newly Available Data on
Depression-Related Feelings Among Adolescents
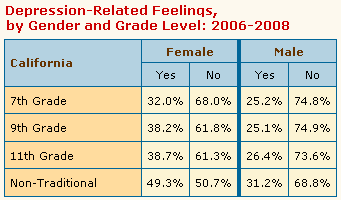 As noted in our recent youth suicide data release, boys are four to five times more likely to commit suicide than girls. One factor associated with youth suicide is depression – a measure of which was recently added to kidsdata.org, as part of its continuing statewide expansion. These data, which measure depression-related feelings, not clinical depression, come from the California Healthy Kids Survey (CHKS), a statewide survey of students that was developed and is administered by WestEd for the California Department of Education. The survey asked students whether they “had felt so sad and hopeless every day for two weeks or more that you stopped doing some usual activities.”
A few highlights:
- According to 2006-2008 data, about more than 1 in 4 California youth in grades 7, 9, and 11 expressed feelings of depression, with girls more likely than boys to report such feelings.
- Students with weak levels of school connectedness were nearly twice as likely as those with strong levels to report feelings of depression.
- Across all racial/ethnic groups, Pacific Islanders and Native American students were most likely to report feelings of depression while other Asian Americans and Caucasians were least likely.
One difference that’s worth noting when comparing depression and suicide data: Although boys are four to five times more likely to commit suicide, boys’ reported feelings of depression are lower than girls across grades 7, 9, and 11.
What are the implications of this difference? What is your organization doing to address this?
Posted by kidsdata.org
Tags: New Data, Statewide Expansion
Just Updated on Kidsdata.org: Juvenile Felony Arrest Rates
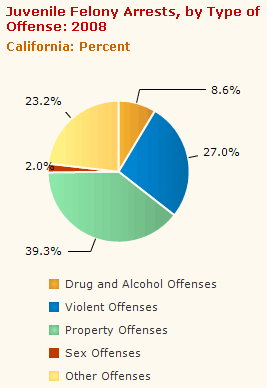 The kidsdata.org statewide expansion continues with new data for juvenile felony arrest rates and total felony arrests for all counties in California. These data are provided by the California Department of Justice, and are further broken down by age, gender, race and type of offense. Insights from these data include:
- California’s juvenile felony arrests have declined over the last 10 years, to 14 per 1,000 youth ages 10-17 in 2008.
- CA juvenile males are at least 4 times more likely than females to be arrested for a felony.
- African American juveniles are arrested at higher rates than their peers in other ethnic groups.
- Property offenses are the most frequent felony offense for CA youth, at about 40% of all offenses. Sex offenses were the lowest, at 2%.
View all data on juvenile arrests>>
Sign up to receive an e-mail alert when these data are updated>>
Posted by kidsdata.org
Tags: New Data, Statewide Expansion


