

Webinar: Childhood Adversity—Data to Help Advocate for Change
Date: Wednesday, March 29, 2017
Time: 10:30 to 11:30 a.m. PT
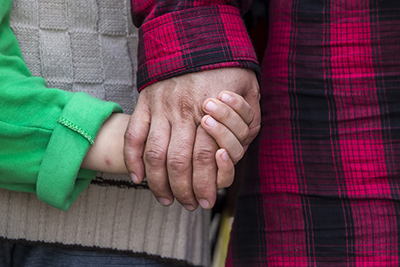
Childhood adversity, such as child abuse and exposure to violence and poverty, can have negative long-term impacts on health and well being. In this webinar, our panelists will discuss how to describe the burden of childhood adversity in your community, how to frame your message most effectively, and how to engage and mobilize your community to address the roots and effects of childhood adversity.
Panelists will also lead participants on a virtual tour of Kidsdata’s Childhood Adversity and Resilience data, research, and policy recommendations.
Marissa Abbott
 Marissa is a California Epidemiologic Investigation Service (Cal-EIS) Fellow at the California Department of Public Health. She is placed in the Safe and Active Communities Branch and primarily supports the CDC-funded California Essentials for Childhood Initiative, a child maltreatment prevention project. Prior to her fellowship, Marissa completed her Master of Public Health (MPH) degree at the University of Rochester School of Medicine and Dentistry as a part of their 3-2 Program.
Nathan Porter
 Nathan is Data Manager at the Lucile Packard Foundation for Children’s Health, where he works on kidsdata.org, a public service website that allows users to easily find, customize, and share data on more than 600 measures of child health and well being. Kidsdata.org makes it simple to incorporate trusted data for every county, city, school district, and legislative district in California into reports, presentations, articles, grant proposals, policy decisions, and advocacy work.
Childhood Adversity and Resilience Data
Childhood Adversity and Resilience
Children with Two or More Adverse Experiences
Children Who Are Usually/Always Resilient
Prevalence of Childhood Hardships
Prevalence of Adverse Childhood Experiences
Posted by kidsdata.org
2 Comments
CA youth mental health hospitalizations up 50 percent since 2007
Between 2007-2015, the rate of youth mental health hospitalizations rose by 50 percent, according to the latest data available on Kidsdata. In seven counties, the rate grew during this time period by more than 100 percent. Fresno county had, by far, the most drastic rise, at 241 percent.
Similarly, both California and the US have begun seeing a rise in self-inflicted injury hospitalizations among youth in recent years. Between 2009-2014, the national rate of self-inflicted injury hospitalizations among youth age 5-20 jumped by 88 percent. During the same time period, the rate jumped 17 percent in California. San Mateo County had one of the highest rates in California, with 71 hospitalizations per 100,000 youth.
The vast majority of emotional health problems begin in adolescence and young adulthood, with half of all disorders starting by age 14. Experts recommend shifting from a focus on prevention and treatment of mental illness to promoting mental wellness. Mental health is influenced by socioeconomic, biological, and environmental factors, and promoting positive emotional health requires coordinated, cross-sector strategies that target underlying causes.
Helpful Links
Preventing Suicide: A Toolkit for High Schools
Bullying and Suicide: A Public Health Approach
Mental Health and Suicidality Among Racially/Ethnically Diverse Sexual Minority Youths
Portrait of Promise: The California Statewide Plan to Promote Health and Mental Health Equity
Supportive Relationships and Active Skill-Building Strengthen the Foundations of Resilience
Stanford Center for Youth Mental Health and Wellbeing
Kidsdata Tip
Happening this Friday: Kidsdata will present “Opportunities for Youth to Overcome Chronic Stress and Improve Mental Health” at the Santa Clara County Children’s Summit.
Posted by kidsdata.org
Post Comment
Half of CA children have immigrant parents
 Sweeping changes to federal immigration policy could have a disproportionate effect on California, where 50 percent of children have at least one immigrant parent, compared to 25 percent nationwide, according to the latest data available on Kidsdata. That translates to 4.5 million children in California alone. In congressional districts 17, 34 and 46, which represent parts of greater Los Angeles and the San Francisco Bay Area, more than 75 percent of children have at least one immigrant parent.
In 2013, California passed immigration legislation to address disparities between immigrant and non-immigrant families. California also offers some benefits to undocumented immigrant children that would not be available under federal law, including Medi-Cal, post-secondary financial aid, and domestic worker protections for their parents. Additionally, the federal Deferred Action for Childhood Arrivals (DACA) program, introduced in 2012, was viewed as important temporary relief from deportation, expanding the socioeconomic mobility and trajectories for eligible youth. Under the new administration, the future of the DACA program is uncertain.
For mixed-immigration-status families, family separation poses serious risks for children, including emotional trauma, housing insecurity and food insecurity. Immigration policies must not lose sight of the well being of children and their families.
Related Data
Immigrants (Summary)
Children Living in Linguistically Isolated Households
Children Living with One or More Foreign-Born Parent
Foreign-Born Population, by Age Group
Race or National Origin as Reason for Bullying/Harassment
Public School Enrollment, by Race/Ethnicity
English Learners in Public Schools
Helpful Links
Immigrant-Inclusive State and Local Policies Move Ahead in 2014-15 (PDF), National Immigration Law Center
The Educational, Psychological, and Social Impact of Discrimination on the Immigrant Child, Migration Policy Institute
Asian Pacific Islander (API) Population Report: In Our Own Words, California Dept. of Public Health, Office Of Health Equity
Urban Institute: Immigrants and Immigration
Migration Policy Institute: Data Hub
Kidsdata Tip
Join Kidsdata on February 24th in Mountain View at the 10th Annual Santa Clara County Children’s Summit.
Posted by kidsdata.org
Post Comment
New data on children with special health care needs
Kidsdata has released new, wide-ranging data on children with special health care needs (CSHCN) for California counties and cities, in collaboration with the Child and Adolescent Health Measurement Initiative.
Notable findings from all data about CSHCN include:
- 36 percent of CSHCN in California receive care within a medical home, compared to 47 percent nationwide
- 32 percent of black children had a special health care need, compared to 24 percent nationwide
- 12 percent of CSHCN in California repeated a grade in school compared to 15 percent nationwide
- 34 percent of CSHCN in California are overweight or obese, with central valley counties, as well as San Francisco County, showing the highest rates of obesity among counties with data.
Like all children, CSHCN need ready access to appropriate medical care, educational opportunities, and, sometimes, social services. By providing local estimates of demographics, insurance coverage, impact on families and quality of care, the new data give us a deeper understanding of the disparities and needs within this community.
Related Data
Prevalence of Special Health Care Needs Among Children
Active California Children’s Services (CCS) Enrollees
Children with Major Disabilities
Insured/Uninsured Children Who Have Special Health Care Needs
Poverty Among Children with Special Health Care Needs
Emotional or Behavioral Difficulties Among Children with Special Health Care Needs
Helpful Links
Lucile Packard Foundation for Children’s Health: Program for Children with Special Health Care Needs
Association of Maternal & Child Health Programs (AMCHP)
California Dept. of Education: Special Education
Maternal and Child Health Bureau: Children with Special Health Care Needs, U.S. Dept. of Health and Human Services
California Children’s Services (CCS) Redesign: Whole-Child Model, California Dept. of Health Care Services
Children’s Mental Health Report, Child Mind Institute
Immigrant Families, Children with Special Health Care Needs, and the Medical Home, Pediatrics
Low-Income Children with Special Health Care Needs and the Affordable Care Act, Catalyst Center
Kidsdata Tip
Want to make sure that you get Kidsdata alerts for specific topics? Manage your email subscriptions.
Posted by kidsdata.org
Post Comment
Latino and black babies see large gains in breastfeeding rates
 Between 2010-2014, Latino and black newborns in California experienced large increases in being exclusively fed breast milk during hospitalization after birth, according to the latest data available on kidsdata.org.
During this time period, Latino newborns saw a 28 percent jump in exclusive breastfeeding. Yet, at 62 percent, the breastfeeding rate for Latino newborns is still below the statewide average of 67 percent. Black babies saw a 22 percent jump, reaching 56 percent in 2014. At 80 percent, white infants continue to have the highest percentages of exclusive breastfeeding in the hospital.
Breast milk is widely acknowledged as the most complete form of nutrition for infants, with a range of benefits for infant health, growth, and development. Infants who are breastfed receive protection from serious health conditions, including respiratory, ear, and gastrointestinal tract infections, allergies, diabetes, and obesity.
Increasing the proportion of children who are breastfed for at least the first year of life—as well as the percentage who are breastfed exclusively for the first six months—are important public health goals. In fact, the California Department of Public Health has a statewide goal to make breastfeeding the normal method of infant feeding for at least the first year of life.
Related Data
Breastfeeding of Newborns, by Breastfeeding Status
Infants Born at Low Birthweight
Infants Whose Mothers Received Prenatal Care in the First Trimester
Helpful Links
American Academy of Pediatrics: Breastfeeding Initiatives
California Breastfeeding Coalition
Breastfeeding Among Minority Women: Moving from Risk Factors to Interventions, Advances in Nutrition
Public Policies to Support Breastfeeding: Paid Family Leave and Workplace Lactation Accommodations, CLASP & Breastfeed LA
Racial and Ethnic Disparities in Breastfeeding, Breastfeeding Medicine
Racial Disparities in Access to Maternity Care Practices That Support Breastfeeding—United States, 2011, Morbidity and Mortality Weekly Report
Kidsdata Tip
Kidsdata is proud to sponsor Southern California’s Open DataFest on January 24 in Los Angeles!
Posted by kidsdata.org
Post Comment
Kidsdata 2016 Highlights
As 2016 comes to a close, we would like to thank all of you who use Kidsdata to improve children’s health and well being in California. We also want to make sure you didn’t miss four of this year’s most notable Kidsdata highlights:
New Data: In October, we released a suite of data on childhood adversity and resilience for the first time in the site’s history. The data release was covered by Slate, California Healthline, and other media outlets. Our team also updated more than 100 other indicators on our site.
Press: In June, the Napa County Board of Supervisors released a report that looked into the possible causes behind the county’s high rate of childhood cancer. The report was produced after a local community group used Kidsdata to help alert the board to the county’s disproportionately high rate of childhood cancer.
New Team Member: In April, we welcomed senior manager of data and research, Lori Turk-Bicakci, to the Kidsdata team! Lori came to us with extensive experience in project management, data collection and analysis, and a strong commitment to eliminating disparities in child health and well being.
Kudos: In January, Kidsdata received commendations from Karen Smith, director of the California Department of Public Health (CDPH) and Diana Dooley, secretary of the California Health and Human Services Agency. Kidsdata collaborates with CDPH on a number of initiatives about children’s health and well being.
Finally, if you’ve used Kidsdata for a successful grant application, project or campaign this year, please share your story with us! We’re always eager to know how Kidsdata has helped your work.
Happy Holidays!
– The Kidsdata Team
Top 5 Advisories
Childhood Adversity Data Now Available on Kidsdata
Infant Care in CA Now Costs as Much as UC Tuition
CA Schools Face Acute Shortage of Nurses and Counselors
Highest Concentration of Child Hunger in CA Shifts to Northernmost Counties
Number of CA Students with Autism Rises Sixfold Since 2002
Posted by kidsdata.org
Post Comment
Measuring resilience among California children
Why is it that some of us are able to overcome childhood trauma while others are not? Resilience, the process of adapting well in the face of adversity, can curb the effects of trauma and adversity such as physical abuse, exposure to substance abuse, and unmet basic needs.
In California, an estimated one third of children are not resilient when facing a challenge, according to parent-reported data from the National Survey of Children’s Health, now available on Kidsdata. The data come from a suite of data related to Adverse Childhood Experiences (ACEs) that were recently released on Kidsdata.
At the county level, the data show that Marin County, in addition to several Gold Country counties, had the highest rates of resilience, at 72 percent. On the other end of the spectrum, Imperial County, along with several Central Valley counties, had the lowest rates of resilience, at less than 65 percent.
A number of policies and programs can help prevent child abuse and neglect, and curb the effects of childhood adversity, including strengthening parent education, improving the social safety net for families in need, and institutionalizing “trauma-informed” community services and health care.
Resilience comes from having adaptive abilities, positive experiences, and a stable, supportive relationship with at least one adult, according to a 2015 report from the National Scientific Council on the Developing Child at Harvard University. And resilience can be built over time, at any age, by engaging in various forms of stress reduction, including meditation and physical exercise, the report says.
Related Data
Childhood Adversity and Resilience (summary)
Children with Two or More Adverse Experiences (Parent Reported)
Children Who Are Usually/Always Resilient (Parent Reported)
Prevalence of Childhood Hardships (Maternal Retrospective)
Prevalence of Adverse Childhood Experiences (Adult Retrospective)
Helpful Links
Child and Adolescent Health Measurement Initiative: Childhood Trauma and Positive Health
California Essentials for Childhood Initiative
Kidsdata Tip
Did you know that you can embed Kidsdata visuals directly on your own web site? This way, data on your site will be updated whenever Kidsdata data are updated. Read our embedding instructions.
Posted by kidsdata.org
Post Comment
Central Valley moms of infants show high rates of childhood trauma
For the first time, Kidsdata now has data that paint a unique picture of childhood trauma experienced by mothers of infants across California.
2011-2012 data from the California Department of Public Health’s Maternal and Infant Health Assessment show two counties (among counties with data), Kern and Stanislaus, where more than 10 percent of postpartum mothers say they experienced four or more childhood hardships, from not having their basic needs met, to parental legal trouble or incarceration, to foster care placement, among others. The higher number of traumatic events a child experiences, the more long-lasting impacts those events may have on the child’s physical, mental, and emotional health.
Fifteen percent of the state’s postpartum mothers say they lived with a parent or guardian with a serious substance abuse problem during their childhoods. When broken down by county however, the Central Valley again shows a disproportionate amount of trauma. In Kern and Stanislaus counties, roughly 20 percent of postpartum mothers were exposed to serious substance abuse during their childhoods. Similarly, Tulare, Stanislaus and Fresno counties were among the counties with the highest percentages of postpartum mothers who experienced family hunger during their childhoods.
Childhood adversity can lead to serious, long-term impacts on one’s health and well being. Resilience, an adaptive response to hardship, can mitigate the effects of adverse childhood experiences.
A number of policies and programs can help curb the effects of childhood adversity, including strengthening parent education, improving the social safety net for families in need, and institutionalizing “trauma-informed” community services and health care.
Related Data
Childhood Adversity and Resilience (summary)
Children with Two or More Adverse Experiences (Parent Reported)
Children Who Are Usually/Always Resilient (Parent Reported)
Prevalence of Childhood Hardships (Maternal Retrospective)
Prevalence of Adverse Childhood Experiences (Adult Retrospective)
Helpful Links
Maternal and Infant Health Assessment
California Essentials for Childhood Initiative
Child and Adolescent Health Measurement Initiative: Childhood Trauma and Positive Health
Kidsdata Tip
Kidsdata launched a suite of data about Adverse Childhood Experiences (ACEs) at the ACEs Conference in San Francisco last month. Read more.
Posted by kidsdata.org
Post Comment
One in five CA adults reports being physically abused as a child
Twenty one percent of California’s adults with children living in their homes report that they were hit, beaten, kicked, or physically hurt by their own parents, or other adults in the home, when they were children. Ten percent say that they were sexually abused as a child. The survey data, now available on Kidsdata, are the first ever released on childhood trauma among the state’s adults with children living in their homes, versus all adults.
The data come from the Behavioral Risk Factor Surveillance System (BRFSS), which is the largest continuously conducted health survey system in the world.
Childhood adversity, sometimes referred to as Adverse Childhood Experiences (ACEs), has come to be seen as an urgent public health crisis. A wealth of research shows that parents who experienced abuse as children have a higher likelihood of abusing their own children. However, parents who were abused do not all repeat the cycle of violence with their own children. Kidsdata’s release also includes data on child resiliency, or the ability to mitigate the effects of childhood trauma.
The higher number of traumatic events a child experiences, the more long-lasting impacts those events may have on the child’s physical, mental and emotional health. These events often lead to serious complications in adulthood, such as chronic diseases, substance abuse and depression. Consequently, parents who were abused as children are more susceptible to these problems as adults, all of which can impair their ability to meet their children’s needs.
Kidsdata’s new data help policymakers, researchers, social workers and practitioners identify opportunities to prevent childhood trauma, allay its effects, and develop better community support systems that promote resiliency. While California has made strides in these areas, continued efforts are needed to ensure that all children thrive and reach their full potential.
Related Data
Childhood Adversity and Resilience (summary)
Children with Two or More Adverse Experiences (Parent Reported)
Children Who Are Usually/Always Resilient (Parent Reported)
Prevalence of Childhood Hardships (Maternal Retrospective)
Prevalence of Adverse Childhood Experiences (Adult Retrospective)
Helpful Links
California Essentials for Childhood Initiative
Child and Adolescent Health Measurement Initiative: Childhood Trauma and Positive Health
Robert Wood Johnson Foundation: Adverse Childhood Experiences
Kidsdata Tip
How do you take your data? Kidsdata’s got tables, bars, trends, maps and pies – try them out!
Posted by kidsdata.org
Post Comment
Childhood adversity data now available on Kidsdata

Today, Kidsdata introduces a brand-new topic to our site, Childhood Adversity and Resilience. The release today coincides with the opening of the Conference on Adverse Childhood Experiences in San Francisco.
The new suite of data complements other Kidsdata topics such as Child Abuse and Neglect, Intimate Partner Violence, and Family Income and Poverty. It includes 56 indicators about the prevalence of adversity and resiliency among California’s children, among mothers of infants reflecting on their childhood, and, exclusive to Kidsdata, among California adults with children living in their homes reflecting on their childhood.
Specific childhood adversity indicators give us a picture of the prevalence of physical, sexual, and verbal abuse inflicted on California children, and exposure to violence, substance abuse, and mental illness. Kidsdata’s release today also includes data on child resiliency, or the ability to mitigate the effects of childhood trauma.
Childhood adversity, sometimes referred to as Adverse Childhood Experiences (ACEs), has come to be seen as an urgent public health crisis. The higher number of traumatic events a child experiences, the more long-lasting impacts those events may have on the child’s physical, mental, and emotional health. These events often lead to serious complications in adulthood, such as chronic diseases, substance abuse, and depression.
California-specific data were compiled from the National Survey of Children’s Health, the Maternal and Infant Health Assessment, and the Behavioral Risk Factor Surveillance System.
This new topic was made possible by a partnership between Kidsdata and the California Essentials for Childhood Initiative and its Shared Data and Outcomes Workgroup, as well as numerous organizations that provided data: Public Health Institute’s Survey Research Group, the California Department of Public Health’s Maternal, Child and Adolescent Health Program, the University of California, San Francisco’s Center on Social Disparities in Health, and the Child and Adolescent Health Measurement Initiative.
Today’s data release helps policymakers, researchers, social workers, and practitioners identify opportunities to prevent childhood trauma, allay its effects, and develop better community support systems that promote resiliency. While California has made strides in these areas, continued efforts are needed to ensure that all children thrive and reach their full potential.
Related Data
Childhood Adversity and Resilience (summary)
Children with Two or More Adverse Experiences (Parent Reported)
Children Who Are Usually/Always Resilient (Parent Reported)
Prevalence of Childhood Hardships (Maternal Retrospective)
Prevalence of Adverse Childhood Experiences (Adult Retrospective)
Helpful Links
California Essentials for Childhood Initiative
Child and Adolescent Health Measurement Initiative: Childhood Trauma and Positive Health
Robert Wood Johnson Foundation: Adverse Childhood Experiences
Kidsdata Tip
Like all data on Kidsdata, the new Childhood Adversity and Resilience indicators can be easily customized, visualized, shared, and in many cases, drilled down to county level data.
Posted by kidsdata.org
Post Comment