Sunsetting Pandemic Policies Highlight Safety Net’s Role in Reducing Child Poverty
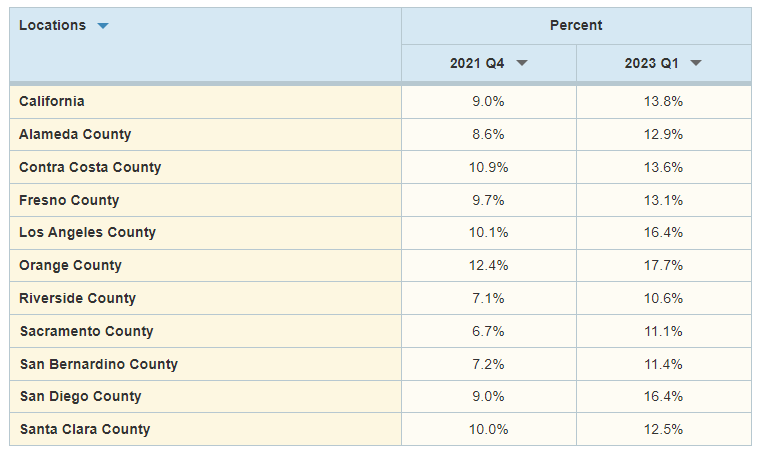
Percentage of Children Ages 0 to 17 Living in Poverty, According to the California Poverty Measure: Fall 2021 to Early 2023

Patricia Malagon, guest author from the Public Policy Institute of California, explores how changes in California’s social safety net during the COVID-19 pandemic have shaped poverty trends across the state.
The California Poverty Measure (CPM), developed jointly by the Public Policy Institute of California (PPIC) and the Stanford Center on Poverty and Inequality, provides a robust measure of Californians who lack the resources to meet basic needs, accounting for local costs of living as well as safety net resources. The CPM poverty rate among Californians of all ages rose from 11.7% in fall 2021 to 13.1% in early 2023, while rates among children jumped even more dramatically. Now that pandemic-era safety net expansions have ended, this upward trend is likely to continue.
To address data limitations and to be responsive to rapidly changing policies, the CPM pivoted during the pandemic to projecting annual poverty rates from pre-pandemic data. For the early 2023 CPM, we combined the 2019 American Community Survey with data on safety net program and economic conditions in January through March 2023. (PPIC technical appendices provide details on data and methodology.)
Because most safety net programs focus on children, program expansions—and their expiration—have had a particularly large impact on child poverty. According to the CPM, child poverty in California jumped from 9% in fall 2021 to 13.8% in early 2023, yet remained below pre-pandemic levels. In early 2023, 1.2 million California children were living under the CPM poverty line—$40,765 annually, on average, for a family of two adults and two children renting their home. And about 195,000 children (2.2%) were living in deep poverty—with less than half the family resources needed to meet basic needs.
In early 2023, according to the CPM, child poverty was highest in families in which the oldest adult was unemployed (29.8%) and in single-parent families (25.6%), followed by families in which the oldest adult had not finished high school (24.1%) or was not a U.S. citizen (24.6%). Across racial/ethnic groups with data, poverty was highest among Hispanic/Latino children (18.2%).
Across counties with data, child poverty was highest in Orange County (17.7%), followed by Los Angeles and San Diego counties (both 16.4%); Riverside County had the lowest rate (10.6%). Across legislative districts, child poverty ranged from 4.7% in Assembly District 71 (San Diego County) to 29.8% in Assembly District 57 (Los Angeles County). Later in the fall, PPIC will release additional estimates for local areas, using two years of combined CPM data.
In early 2023, participation in safety net programs lifted more than 1 in 7 California children, or about 1.3 million kids, out of poverty. CalFresh alone—the only safety net program with pandemic expansions still in effect at the time—lowered child poverty by 5 percentage points; only tax credits had a greater poverty-reducing effect (5.1 percentage points) among measured programs. CalWORKs, Supplemental Security Income, housing subsidies, and other nutrition programs (school meals and WIC) lowered child poverty by less than 2 percentage points each.
If poverty rates continue rising as we expect, this could be an important policy issue next year among newly elected California legislators, many of whom may see poverty increases in their districts. PPIC will continue to monitor poverty trends and assess policies that aim to help Californians meet their basic needs.
Read more from PPIC on poverty and inequality in California.
Children’s Health Resources
Approximately 9% of federal spending went to children in 2023, and this figure is projected to fall to 6% over the next decade, according to Urban Institute’s new analysis of federal expenditures on children from 1960 to 2023.
You Count Data Hub: California Youth Homelessness Timeline
The California Homeless Youth Project has developed a comprehensive visual timeline pairing youth homelessness counts with legislative history and budget allocations from 2011 to 2023.
Launching Lifelong Health by Improving Health Care for Children, Youth, and Families
A new consensus report from the National Academies of Sciences, Engineering, and Medicine explores a transformed child and adolescent health care system—one that rethinks health care financing, public health investment, community partnerships, and accountability—to better meet all children’s needs.
Debt in America: An Interactive Map
New state and national data on medical, student loan, and auto/retail/credit card debt among young adults are available now on the Urban Institute’s Debt in America dashboard. See how young people in communities of color are faring compared with their peers in white communities, and explore policy and program options to support financial stability for young adults in the accompanying blog.
Recently Released Data
We recently released data about family income and poverty. See links to the latest here.
Posted by kidsdata.org
This entry was posted on Thursday, October 24th, 2024 at 10:44 am. You can follow any responses to this entry through the RSS 2.0 feed. You can leave a response, or trackback from your own site.


