

Archive for September, 2020
Over Half of California Students are High-Need
High-Need Students in California, 2019
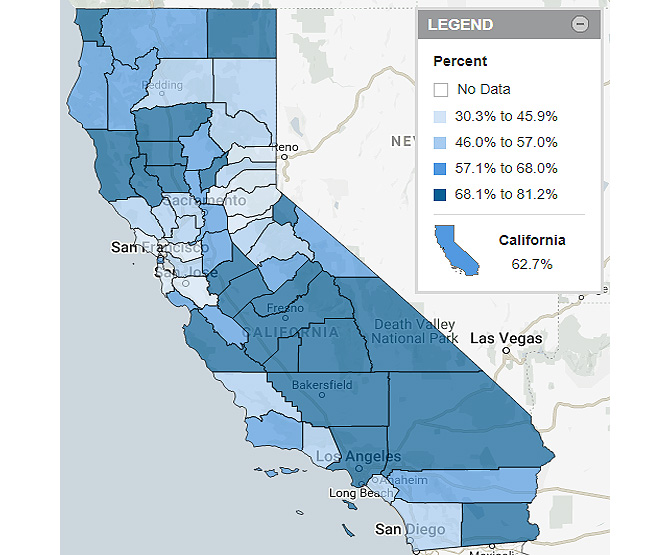
In California, 63% of students were considered high-need in 2019, meaning they were eligible for free or reduced price school meals, were English Learners, or were foster youth. School districts varied widely in the percentage of students with high-need, from less than 3% to more than 99% among districts with data. Looking further into understanding high-needs students, more than 59% of California school children – over 3.5 million students – were eligible for free or reduced price school meals (FRPM) in 2020, up from 51% in 2007. Not only are students eligible for FRPM based on family income, but also if they participate in the CalFresh or CalWORKS programs, are eligible for the Migrant Education Program, are homeless, or are foster youth.
The indicator describing high-need students is a part of a new topic on kidsdata.org, Student Demographics. The new topic was created to celebrate student diversity in California and increase our understanding of diversity in terms of race/ethnicity, family economics, and more. Student demographic trends are useful for assessing needs and planning school and community services, and ultimately, they play an important role in informing policies and practices that address intransigent inequities. The topic, Student Demographics, combines relevant indicators previously under other topics as well as two new indicators: high-need students and students eligible for the migrant education program.
Student Demographics Resource
Getting Down to Facts II describes the challenges and the promising efforts to achieving California’s vision of providing an equitable public education.
Recently Released Data
We recently released data about Student Demographics and Characteristics of Children with Special Needs. See links to the latest here.
Posted by kidsdata.org
Post Comment
Demographic Data on California Children

The Kidsdata team just released data on child demographics with 35 updated indicators. Find data on births, child populations, and projected child populations to 2060 in California. Data are broken down by age group, gender, and race/ethnicity. Additional county and school-district level student data are available by parent education level and sexual orientation and for transgender students.
Below data figures, you will find a section titled, “Learn More About.” In this section, see “Measures of Demographics on Kidsdata.org” for a summary of the indicators and data sources that describe California’s child population.
Demographics Resources
The US Census Bureau summarizes research on the long-standing undercount of young children in decennial censuses including which children have highest risk of coverage errors and what steps the Census Bureau has taken to improve the count in the 2020 Census.
In a previous Kidsdata News, Beth Jarosz from Population Reference Bureau explains how population projections can help inform policies and programs that support children’s health and well-being.
Children’s Health Resources
Child Trends explores challenges in Supporting Families and Child Care Providers during the Pandemic with a Focus on Equity and offers strategies to address families’ and providers’ unique needs.
The Lucile Packard Foundation for Children’s Health continually updates a curated list of COVID-19 Resources for Children with Special Health Care Needs.
Posted by kidsdata.org
Post Comment