

Archive for October, 2025
Number of California Kids at a 30-Year Low, and Projected to Continue Dropping
Demographic trends help project needs for education, child care, health care, and other services. To plan appropriate policies and programs, policymakers need to understand the size and composition of the communities they serve, how these vary by location, and how populations are changing. In California, growing numbers of retiring seniors and a shrinking child population point to workforce and taxpayer shortages in the coming decades. These population dynamics mean children are a more important resource than ever before—creating new urgency to ensure today’s children have the supports they need to reach their full potential.
Number of California Children Ages 0 to 17: 2004 to 2025
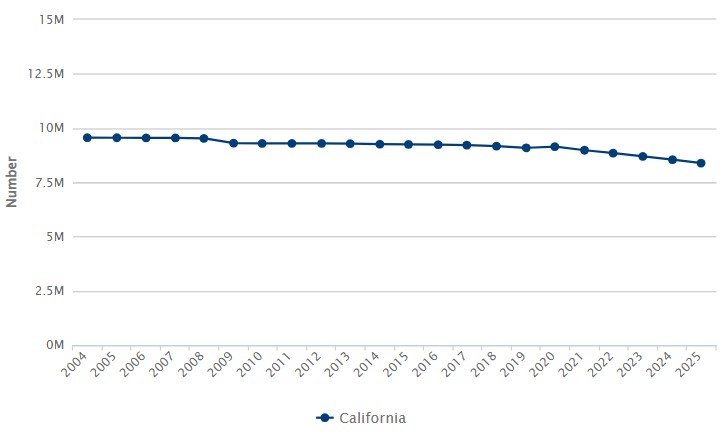
In 2004, 9,559,942 children ages 0 to 17 lived in California; today more than 1 million fewer kids (8,386,716) call the state home. In just the last five years, California’s child population has fallen by more than 760,000 and in the next five years it’s expected to fall by another 635,000. By 2060, fewer than 6.7 million children will live in California—a drop of more than 30% from the mid-2000s peak.
Compared with 1995—the first year for which comparable data are available—the number of children is down statewide and in most counties. But trends vary widely at the local level. The 10 California counties with the smallest child populations (fewer than 5,500 in 2025) have seen some of the steepest declines—all have lost at least 15% of their child population in the last 30 years, and half have lost more than 30%. Looking forward to 2060, three of these counties—Lassen, Modoc, and Mono—are projected to have less than half as many children as today.
Yet small counties are not alone—Los Angeles (the state’s largest county by far) has lost 29% of its child population since 1995 and is projected to lose 31% more by 2060.
On the other hand, some regions—particularly the Sacramento area and San Joaquin Valley—have experienced strong child population growth over the last three decades. Fresno, Kern, Kings, Madera, Merced, Placer, Sacramento, San Joaquin, Tulare, and Yuba counties all have seen their number of children grow by at least 10% between 1995 and 2025.
Among the 12 counties with the fastest growth over this period, five have a child population with a Hispanic/Latino majority above 70%. Statewide, just under half of kids (48%) are Hispanic/Latino, around one-fourth (26%) are white, 13% are Asian, 7% are multiracial, 5% are African American/Black, and less than 1% are American Indian/Alaska Native or Native Hawaiian/Pacific Islander. At the county level, estimates of the share of Hispanic/Latino children in the total child population range from 11% to 91%, while the share of white children ranges from 4% to 66%.
Society’s reliance on a decreasing number of increasingly diverse children highlights the importance of policy and program options that nurture every child. See KidsData for strategies aimed at aligning service systems with demographic trends and ensuring that adequate, culturally responsive resources are in to place to support thriving children, families, and communities.
KidsData in the News
Crisis Point: Spike in Black Youth Suicide Rates Trigger Alarm Among Advocates
A California Black Media story examining rates of suicide among young people of color statewide and nationally cites KidsData’s indicator of youth suicides by race/ethnicity.
How the Federal Government Shutdown Is Affecting the Inland Empire [subscription required]
A story published in news outlets across Southern California on the impacts of the federal government shutdown cites KidsData on Women, Infants, and Children (WIC) program participation in Riverside and San Bernardino counties.
Children’s Health Resources
Evidence-Based Youth Mentorship Programs
A new resource from the California Essentials for Childhood Initiative looks at evidence-based programs that promote mentorship and adult engagement with youth and provides information about their effectiveness.
Measuring Childhood Disability Using the National Health Interview Survey
A new analysis of data from the National Health Interview Survey estimates the percentage of U.S. children with disabilities using four distinct identification strategies. Depending on the strategy, estimates range from 11% to 23% and show differences in disability prevalence by gender, race/ethnicity, and income level.
Opportunities
California Health Interview Survey (CHIS) Data User Training
Join the UCLA Center for Health Policy Research Thursday, October 30, at 12:00 p.m. PT to learn how to access CHIS estimates for 2024 and earlier years using the AskCHIS™ and AskCHIS™ Neighborhood Edition query tools.
Submit a Comment to Save the Current Population Survey Food Security Supplement (CPS-FSS)
Through Monday, November 3, at 8:59 p.m. PT, dataindex.us is collecting perspectives and comments on the announced termination of CPS-FSS, the only nationally representative data collection on household food insecurity. Your support for CPS-FSS will be shared with state departments of agriculture, whose leaders can urge federal decision-makers to reinstate this critical dataset.
Posted by kidsdata.org
Post Comment