


Subgroup Data Paint a Clearer Picture of Breastfeeding Across Asian Communities
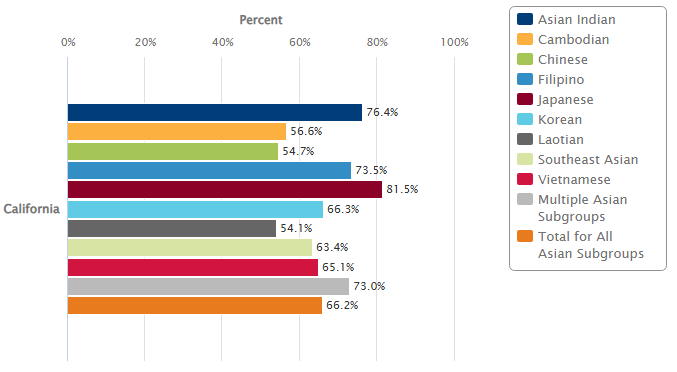
Rates of Exclusive In-Hospital Breastfeeding of Newborns, by Asian Subgroup: 2022–2024
Early breastfeeding initiation followed by continued breastfeeding through at least the first two years of life is recommended by leading health organizations and is shown to have a range of health benefits for both child and parent.
In 2022–2024, 94% of California infants born in hospitals were fed at least some breast milk during their hospitalization, and 69% were breastfed exclusively—up from 60% in 2010–2012. Among Asian infants, statewide rates of exclusive in-hospital breastfeeding followed a similar trend, rising from 58% in 2010–2012 to 66% in 2022–2024. Locally, percentages ranged from 35% to 83% of Asian infants receiving only breast milk during their hospitalization, across the 37 counties with data for 2022–2024.
New data available now on KidsData allow users to break down and compare in-hospital breastfeeding rates for 10 Asian subgroups, by county and over a period of 15 years. These data show even greater variation by Asian subgroup than by racial/ethnic category. For example, in 2022–2024, rates of exclusive and any breastfeeding among Japanese infants surpassed corresponding rates for white infants, the racial/ethnic group with the highest rates statewide. Meanwhile, rates among Chinese and Laotian infants were lower than among African American/Black infants, the racial/ethnic group with the lowest rates.
At the county level, Fresno’s Southeast Asian infants recorded an exclusive in-hospital breastfeeding rate of 26% in 2022–2024, compared with El Dorado’s Asian Indian infants at 93%—a range that includes only county-level subgroup rates based on at least 20 infants who breastfed exclusively. Statewide, exclusive breastfeeding among Vietnamese newborns increased more than 40% between 2010–2012 (46%) and 2022–2024 (65%).
Read more on KidsData about supportive, culturally appropriate strategies in hospital, workplace, and community settings to address barriers that make successful, long-term breastfeeding more difficult for some families.
Health Data Resources
KidsData has partnered with The Children’s Partnership on this year’s “A Child Is a Child” fact sheet series, collaborating on updated snapshots of young people in communities often marginalized in data and decision-making. The first four fact sheets—highlighting data on Asian American children, Native Hawaiian and Pacific Islander children, children in immigrant families, and LGBTQ+ children and youth—are available now, with more coming later this year.
Poverty in the United States: 2025
On September 15 (“Poverty Day”), the U.S. Census Bureau releases poverty estimates for the nation. According to both the official poverty measure (OPM) and Supplemental Poverty Measure (SPM, which factors in family resources and expenses not included in the OPM as well as geographic variation), 13.4% of children ages 0–17 nationwide lived in poverty in 2025. Stay tuned for updated OPM and SPM data for California—at the state and county level, overall and by race/ethnicity—coming soon to KidsData.
Posted by kidsdata.org
This entry was posted on Tuesday, September 29th, 2026 at 11:41 am. You can follow any responses to this entry through the RSS 2.0 feed. You can leave a response, or trackback from your own site.